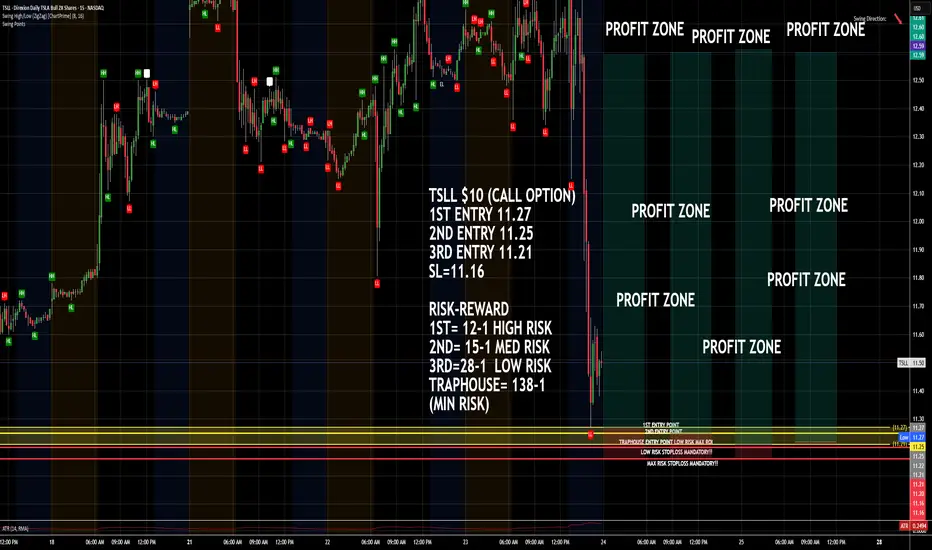
TSLL $10 CALL OPTIONIf price drops done into entry zone which is detailed on the chart, Enter the trade with a Call Option $10 or below!! Remember to set your stop loss!! Trap has potential!
P.S. If when market opens and share price doesnt drop but continue to rise from that point, then just enter in on a call and cross your fingers lol!!! But price should go up because of that dramatic drop !!!
CYMPLE
TSLL trade ideas
2X Levered TESLA TSLL: $7.23 level since 2023Since 2023, when TSLL 2X levered Tesla hit $7.23 it tend s to see significant upside. The chart show the peak profit levels from the $7.23 level. I am waiting for it to drop below and then buy when price rises above the level. The horizonal arrows at the top show how many days it takes to hit the peak in trade. The horizontal arrow on the bottom indicated the number of days it tool to fall from the peak to the next buying level.

Updated thoughtsThe chart speaks for itself. It’s going to go up then drop. Please lmk if yall have any other thoughts/ideas. Good luck traders!

TSLL Bull FlagNASDAQ:TSLL Holding up well — even with today’s market gap down, this TSLA ETF is maintaining strength and reclaiming ground. There's a key resistance around $16 that needs to be cleared before a potential move toward $20.

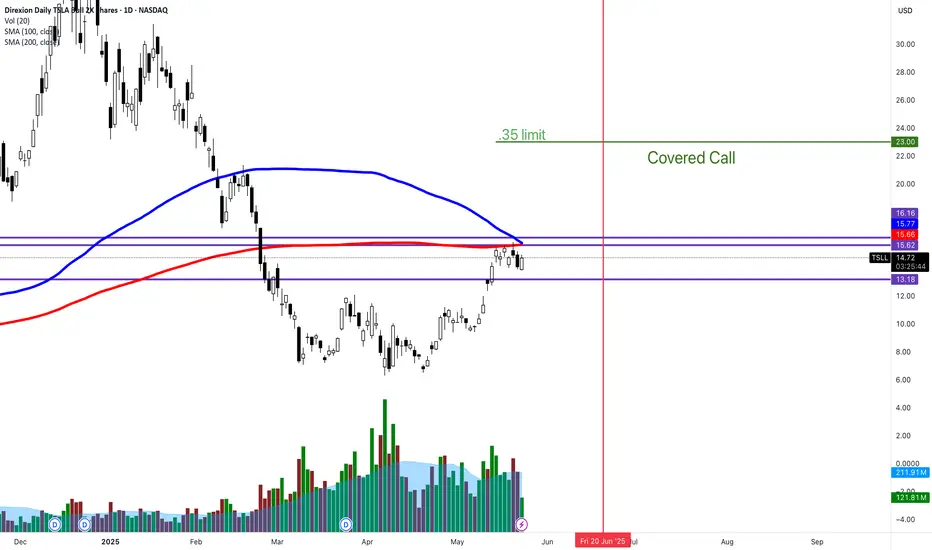
TSLL JUNE covered call What is REALLY cool about this covered call is
100/200 SMA acting as resistance. I'm getting 1.6% of premium. This CC is over 2 closed days in the market and it's $10 HIGHER than stock price?!?!
This is crazy. I love it.
Tesla Euphoria to Capitulation and Back AgainOver the past 12 months, Tesla’s price action reads like a three-act drama:
Euphoria (Nov ’24 – Dec ’24)
Rampant Breakout: After a multi-month range, TSLA erupted from low-20s to a peak near $42, driven by record deliveries and renewed growth optimism.
Blue Zone Strength: The blue-shaded sessions on the right highlight a powerful institutional bid, lifting price steadily with few pullbacks.
Capitulation (Jan ’25 – Mar ’25)
Profit Taking & Macro Headwinds: Q4 earnings misses, rising rates, and softer comps triggered a swift retreat. TSLA plunged from $40 to sub-$10 in roughly ten weeks—an 80% drawdown that shook even the most ardent bulls.
Failed Bounce Attempts: Multiple red “S” markers at lower highs underscored sellers’ resolve, hammering out a vicious downtrend.
Accumulation & Base Building (Mar ’25 – May ’25)
Triple Bottom Formation: Notice the three “bottom” labels around $6.13 (the P0 pivot and prior yearly low). Each test showed shrinking volatility and thinner red candles, classic signs of selling exhaustion.
Dynamic Support Holds: The turquoise dots hugging the lows trace TSLA’s dynamic falling-wedge support. By early April, price chopped sideways in a $6–$10 band, consolidating losses.
2. Technical Set-Up: A Coiled Spring
As of today, TSLA has climbed back to $11.34, probing critical pivots:
Near-term Resistance:
Monday’s High (~$11.85) – the first hurdle for bulls. A decisive break above would flip short-term supply into demand.
Dynamic Fib Resistance (~$10.35 & $9.96) – these falling-wedge levels have already been cleared, validating the nascent turn.
Support Floors:
Monday’s Low (~$10.35) – now a springboard for buyers.
Base of the Wedge (~$6.13) – every retest here was met with bids, marking a reliable long-entry zone on deep pullbacks.
Volume & Momentum:
Recent green candles have come on elevated volume relative to March lows, suggesting fresh participation.
The slope of higher lows in the turquoise dynamic support dots indicates improving momentum across daily and 5 m timeframes.
3. Market Sentiment & Catalysts
Earnings & Guidance: With Tesla’s Q1 numbers due in the next two weeks, earnings season could be the spark that sends TSLA either flying through $12 or knocking it back to the wedge.
Macro Backdrop:
Rate Outlook: Any dovish pivot from the Fed could flood liquidity back into “growth-at-a-reasonable-price” names like TSLA.
EV Adoption Narrative: New model announcements or manufacturing milestones (e.g., Cybertruck ramp) would reinforce the long thesis.
4. Strategic Takeaways
Aggressive Players: A break and close above $11.85–$12.00 on daily charts could be used as a fresh long trigger, targeting $14 (year-open pivot) and then $18–$20 as institutional accumulation zones.
Risk-Managed Entries:
Pullback Buyers: A retrace to the former Monday low (~$10.35) is a lower-risk entry with a stop just under $9.95 (the next dynamic fib level).
Option Plays: For defined risk, out-of-the-money calls near $12 expiring in 4–6 weeks may capture an earnings-driven surge.
Defensive Stance: If price fails at $11.85 and closes back below $10.35, the pattern risks returning to the base at $8–$9, so profits should be booked or stops widened accordingly.
5. Conclusion: Coiled for a Move
After the brutal drawdown earlier this year, Tesla’s chart now portrays a textbook falling-wedge resolution into a higher-low base, punctuated by multiple “bottom” labels and dynamic support tests. Approaching the $12 threshold, the stock is coiled like a spring: either it unleashes into a new leg up toward $14+ on strong participation, or it reverses into a tighter range, offering fresh long entries nearer $10.
In short: TSLA’s journey from euphoria to despair and through disciplined accumulation has set the stage for its next directional verdict. Watch $11.85–$12.00—and manage risk around the former week’s pivots—to navigate what could be a decisive inflection in Tesla’s 2025 saga.

If Tesla Bottoms Here TSLL x2 Leverage ETF Could Be The Play. These are tough markets but if macro economics settle out and bonds quit rolling up, I would bet on TSLA via TSLL to get maximum exposure. Not financial advice.

JM-CAPITAL – TSLL Stock Analysis | April 1, 2025
This is a monthly top-down analysis using trendlines and Fibonacci retracement from the low of $6.32 to the high of $41.40. I use trendlines to establish my directional bias and to map out key support and resistance zones. This method has consistently helped me identify strong entry points for options trading.
Despite the recent tariff-driven volatility, the candlestick has respected my trendline, which I view as a major support level. I entered my options trade at $9.16 with an expiration date of April 25, giving the trade enough time for the tariff concerns to settle and for the market to establish its direction.

Trade Update for Mentorship Members $NVDA $TSLA $SPY $TSLLCaution around possible bear trap/liquidity sweep. Discussing support & resistance/Fib levels to watch. Discussing trade exits, and gameplan for trading today.

$TSLL – Major Reversal in Play? Is tesla finally back???
TSLL has been in a prolonged downtrend but is now showing signs of a potential bottoming pattern. Price recently tested a key support zone between $6.26 and $7.18, holding firmly after multiple attempts to break lower.
Current price action is forming a strong base, and the first green candle breaking out of this range suggests momentum may be shifting.
The upside target is set near $20, which lines up with a previous consolidation zone and psychological resistance. A break and hold above current levels could trigger a strong move higher.
Risk is defined below support, making this a favorable risk-to-reward setup. Watching closely for follow-through confirmation.

Weekly Levels Update for mentorship members. $NVDA, $TSLA, $QQQUpdate on NASDAQ:TSLA , NASDAQ:QQQ , NASDAQ:NVDA , NASDAQ:BIDU , reviewing Fib levels, SMAs, support & resistance levels as well as open trades.

TSLL + TSLA... He can buy one, but can you stop a fire saleSo here is an interesting chart of Tesla long etf. Just for consideration, nothing special. Fib connection at the highs of the two red circles and then connecting to the low at the bottom red circle. The Cyqo-B0wstr1ng at work...
Can Log function it or not to see if you levels agree.
closer view at a smaller time frame. All line same as Daily:
TSLA chart:
non log 4hr:
log 4hr:
4hr overview with log:
4hr overview with no log:
Enjoy

TSLL.....TSLA jump back! great set-upI've been watching this set-up for a while and it looks like it's ready to pop! we're looking at 5-10% easily. Watch with SMA10 on 30min chart.
Best of luck and always do your own due diligence!

Managing TSLLPlaying earnings call on TSLA.
Probably earnings will not be great. TSLA will probably gap down and we'll have to manage the position

Who is interested in Selling Puts under $20 ?Inauguration is coming.
Do we know if Trump will give Elon what he is expecting?
Place your bets.
I will be buying below $ 20.
Selling Puts to get paid just in case.

TSLL COVERED CALLDoing this one again. The premiums are so cool and fun. 2.4%?!! For 2 weeks? Wow. And, The ability to sell much higher than it is now?
Plus, the trend is still bullish on TSLA. :)

The Wind Surfer Universe Trading SystemThis shows a Stock Chart Universe - In Formation is
where the following are all above each other.....
We want to catch the Windsurfer at the point of take off from
the Aqua Blue Water into the Blue Sky and follow it up into space
and Sell most the Long Position when the Windsurfer is pushed
down by Gravity in space, and goes back toward Earth/Water basically....
Purple Haze , Stars in Space
Blue Sky
Aqua Blue Water
Black Muddy River Lava
Red Magna
The Price is the Windsurfer - the Slope of the Water, (Ocean, River) and
the Wind, Gravity, and Buoyancy all are Indicators and factors, that help
decide where the next move will be, and where we are currently.


TSLL covered callExpiring 12/6/2024. Snagging some theta days.
I WOULD LOVE to sell here. Gorgeous profit. I am also inclined to buy this back for 75% premium capture next week.

ELEPHANT BAR $TSLLElephant bars are significantly larger bars than the previous bars.
Red elephant bars suggest downward price pressure and an indication that smaller red bars are to be expected.
Green elephant bars indicate upward price movement and additional smaller green bars to come.
NASDAQ:TSLA ( Tesla ) is leading the way to a future of Autonomous Transport ( Buses, Cars ) and
Non-Human Labor #Optimi.
Let that sink in....

TSLL covered call expiring THIS FRIDAY I wouldn't mind selling my TSLL shares here, because that would be profitable.
Buy low, sell high?
Plus this is like, 3.5% for 3 trading days?
And my strong assumption is, if I DID sell at $24, this Friday, I Would be able to re-buy later??
;-)

TSLL $20 is programmed.Told before that the HTF lows were already in on NASDAQ:TSLA and we weren't visiting the $100 low again, now that we also put in a new HTF low if we have NASDAQ:TSLA going to $300 from here, NASDAQ:TSLL would easily hit $20.They recently switched NASDAQ:TSLL to a 2x long etf and it also pays %8 yearly dividends, so it's a good buy for me.

Parabolic SAR Technical IndicatorParabolic SAR Technical Indicator
📜 The Parabolic SAR (Stop and Reverse), first introduced in 1978, is a technical indicator used to identify potential trend reversals in financial markets. It is represented as a series of dots placed above or below the asset’s price. The key concept behind the Parabolic SAR is that the price follows a parabolic movement until a trend reversal occurs.
📊 When the SAR points are below the price, it indicates an uptrend. Conversely, when the points are above the price, it suggests a downtrend. If the price touches or surpasses the SAR, a reversal signal is generated, and the dots switch position. This can help traders identify potential changes in market direction.
📈 This indicator is most effective in trending markets. However, in sideways or directionless markets, the Parabolic SAR tends to generate false signals, which can lead to confusion. Therefore, its best application occurs in well defined bullish or bearish markets.
🧮 Functionality and Mathematics
▪️ The Parabolic SAR falls under the category of trend-following indicators. Unlike oscillators, which try to predict price changes, focuses on confirming the current market direction, helping traders capitalize on extended market moves.
🤖 Mathematically, is based on a formula that adjusts its value according to price and time. The calculation incorporates two key variables
1️⃣ EP Extreme Point🟰 The highest or lowest point reached during the current trend.
2️⃣ AF Acceleration Factor🟰 Starts at a low value, like 0.02, and increases in fixed increments each time the price reaches a new high or low.
🚀 In essence, the Parabolic SAR measures the trend’s acceleration, dynamically adjusting its values to follow the price.
👨🏫 Considerations
▪️ Parabolic SAR is part of traditional technical analysis and is widely mentioned in J. Welles Wilder’s book New Concepts in Technical Trading Systems. While useful for identifying trends, it is less effective in markets where the price consolidates, as it tends to generate more false positives, which can create confusion.
▪️ Other examples of trend following indicators include moving averages simple or exponential and the MACD.
🧐 Have you heard of this indicator? Which do you consider an essential one?
