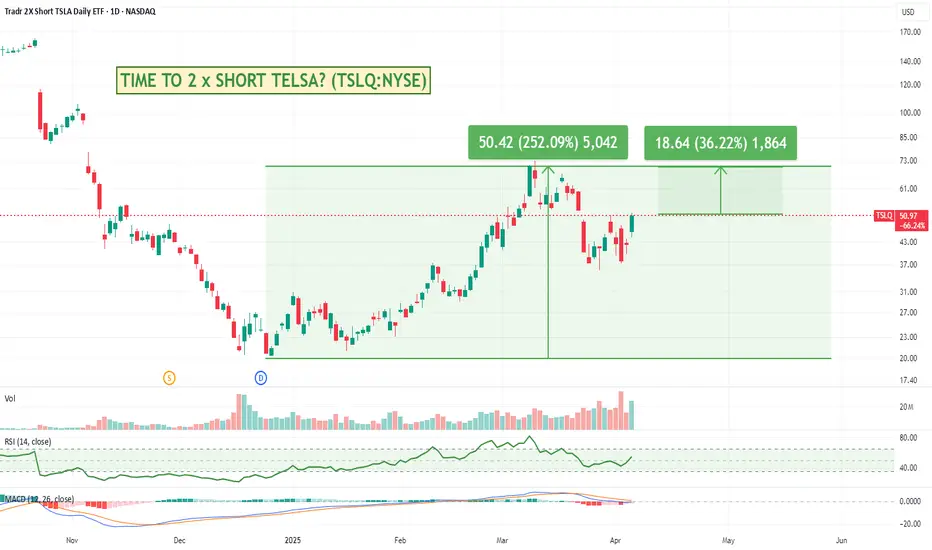
Is it time to short Tesla? If so TSLQ might be of interest.Tesla's ongoing turbulence is getting harder and harder to ignore even amongst some of the permabulls. Notably, Wedbush Securities' Dan Ives, a long-time Tesla bull, recently slashed his 12-month price target by a whopping 43% reduction noting concerns over CEO Elon Musk's political entanglements and the impact of new tariffs under President Trump's administration.
If you think TESLA is likely to keep going down, you might want to consider NASDAQ:TSLQ a leveraged short position. TSLQ aims to deliver twice the inverse (-200%) of Tesla's daily performance.
Its important though to understand that these types of leveraged trades are really only meant to be shorter term and if the stock starts to go up, then you will be losing at 2x the rate as well. Overtime, any wiggle up and down tends to work against you - even if the stock continues to go down.
Definitely not trading advice, but something I was asked about today, and the current climate doesn't look overly positive for Tesla or Elon.
TSLA article: finance.yahoo.com
TSLQ info: www.tradretfs.com
TSLQ trade ideas
TSLQ/USD – 30-Min Short Trade Setup!📌 📉
🔹 Asset: TSLQ (Tradr 2X Short TSLA Daily ETF)
🔹 Timeframe: 30-Min Chart
🔹 Setup Type: Bearish Breakdown Trade
📌 Trade Plan (Short Position)
✅ Entry Zone: Below $41.50 (Breakdown Confirmation)
✅ Stop-Loss (SL): Above $44.73 (Break of Resistance & Trendline)
🎯 Take Profit Targets
📌 TP1: $38.79 (First Support Level)
📌 TP2: $35.75 (Final Target – Extended Bearish Move)
📊 Risk-Reward Ratio Calculation
📉 Risk (SL Distance): $44.73 - $41.50 = $3.23 risk per share
📉 Reward to TP1: $41.50 - $38.79 = $2.71 (1:0.83 R/R)
📉 Reward to TP2: $41.50 - $35.75 = $5.75 (1:1.78 R/R)
🔍 Technical Analysis & Strategy
📌 Rising Wedge Breakdown: Price attempted to break out but faced resistance around $41.74, indicating seller dominance.
📌 Bearish Reversal Signal: The trendline is breaking, showing potential downside pressure.
📌 Breakdown Confirmation: A strong bearish candle closing below $41.50 with increased volume will confirm the move.
📌 Momentum Shift Expected: If the price stays below $41.50, a move toward $38.79 (TP1) and $35.75 (TP2) is likely.
📊 Key Support & Resistance Levels
🔴 $44.73 – Strong Resistance / Stop-Loss Level
🟡 $41.50 – Entry / Breakdown Level
🟢 $38.79 – First Support / TP1
🟢 $35.75 – Final Target / TP2
📉 Trade Execution & Risk Management
📊 Volume Confirmation: Ensure strong selling volume below $41.50 before entering.
📈 Trailing Stop Strategy: Move SL to entry ($41.50) after TP1 ($38.79) is hit.
💰 Partial Profit Booking Strategy:
✔ Take 50% profits at $38.79, let the rest run to $35.75.
✔ Adjust Stop-Loss to Break-even ($41.50) after TP1 is reached.
⚠️ Fake Breakdown Risk
❌ If the price bounces back above $41.50, it could indicate a false breakdown—exit early.
❌ Wait for a strong bearish candle close below $41.50 for confirmation before entering aggressively.
🚀 Final Thoughts
✔ Bearish Setup – Breaking below $41.50 could lead to lower targets.
✔ Momentum Shift Possible – Watch for volume confirmation.
✔ Favorable Risk-Reward Ratio – 1:0.83 to TP1, 1:1.78 to TP2.
💡 Stick to the plan, manage risk, and trade smart! 🚀🏆
🔗 #StockTrading #TSLQ #ShortTrade #BreakdownTrade #TechnicalAnalysis #MomentumStocks #ProfittoPath #TradingView #StockMarket #SwingTrading #RiskManagement #ChartAnalysis 📉🚀

TSLQ from $14.06 to $20MODs have suggested that I provide more detail about the picks I make.
Sorry. I'm not as verbose as y'all, and I don't like things to be complicated.
My trading plan is very simple.
I buy or sell at top & bottom of parallel channels.
I confirm when price hits Fibonacci levels.
Bonus if a TTM Squeeze in in play.
I hold until target is reached or end of year, when I can book a loss.
So...
Here's why I'm picking this symbol to do the thing.
Price at bottom top of channels (period 100 52 39 & 26)
Stochastic Momentum Index (SMI) near oversold level
VBSM spiked negative
In at $14.04
Target is $20 or channel top
Stop loss is $13.75

$TSLQ - Range BoundTSLQ is an ETF that bets against Tesla ( NASDAQ:TSLA ) and has been trading within a certain range for nearly 10 months. It is worth keeping an eye on this ETF as it may potentially break out to the upside. Although I have invested in NASDAQ:TSLA shares, I would use NASDAQ:TSLQ as a hedge for my long-term portfolio.
The pivot point outside of the range is $41, with a target of $60 (+45%). As this is a 1x bearish ETF, it would imply that NASDAQ:TSLA 's stock price would be approximately $95.

**TSLA Short ETF** $TSLQ Daily Chart (Bearish Scenario) **TSLA Short ETF**
NASDAQ:TSLQ Daily Chart (Bearish Scenario) : For educational purposes only, NFA.
#1: Price below daily 9 EMA
#2: Daily forming Bearish expanding triangle, which is bearish reversal pattern.
#3: Bearish Divergence on daily RSI, which is also a reversal signal.

$TSLQ - $13.95 Short Term Technical PTMassive bearish Head AND Shoulder formation with a crack below neckline. length of head to neckline = projected drop to downside. Technical Price Target of around $13.95.

TSLQ | Tesla Bear ETF | LONGUnder normal market circumstances, the adviser will maintain at least 80% exposure to financial instruments that provide inverse exposure to the daily performance of TSLA. The fund is an actively-managed exchange-traded fund ("ETF") that seeks to achieve on a daily basis, before fees and expenses, -100% performance of TSLA for a single day, not for any other period, by entering into one or more swap agreements on TSLA. The fund is non-diversified.
