Top of ULTABought PUTS yesterdays on ULTA because I knew I'd miss todays morning move to hit the 1.618 fib extension. Today should be the highest point ULTA will hit for some time. Price target was 511 and some change for the smaller 1.618 extension which began on Jan 18 '23 as well as the larger 1.618 fib extension which began on Dec. 8 '22 which were both hit this morning. Weekly RSI is at 80.53 and daily is 73.17 and starting to trend downward. Short term price target is 458 (.382 fib retracement) and long term price target of 427 (.618 fib retracement). Something to note is the downgrade to $400 by Wells Fargo earlier this month.
Not financial advice
ULTA trade ideas


UltaMinor rising wedge inside a major one.. see link..
Pullback To support here or 475 .. then let's see 8f the damn breaks

ULTA Beauty Ready for a Pullback 0.5 leveULTA is sitting below a double top and looking at the Fib levels retraceing the uptrend finishing out December.
The RSI shows relative weakness while the MACD shows the trend after a crossover of the lines at
each of the two tops.
I believe this stock is ready for a short position with a stop loss just above the double top.
The first target would be the Fib 0.5 level from the retrace of the uptrend.
The second target would be the red line showing the top of the recent high volume area of the volume profile.
Conversely, I may wait and watch for a bounce off one of the two central
Fib levels or that red line and and take a long trade targeting the double top.
( Trade well , trade often)

ULTAHorrible stock to trade ... defying all technicals here , but thats what you get in rising wedge patterns. I've seen this move happen with Google and Target from 2020-2022 ; that didn't end pretty and neither will this...
All its going to take is a bad earnings and a few stock down grades.
I wouldn't play any contracts shorter then August EXP

ULTA Short - retesting trend lineMultiple rejections across this trend line, likely to reject again here.
Expecting a 40+ point pullback.
Target is 440. Stop is a daily close above 500.

Classic bull flag setupEverything is in the chart.. classic bull flag setup on $ulta. Financials are great, EPS is solid, basically recession-proof at the moment.
CALLS idea - wait til retest of 410-420 and grab $500 calls 2 months out.
PUTS idea - wait til top of channel is hit then grab 430 puts 1 month out.
This is not financial advice, just for fun!

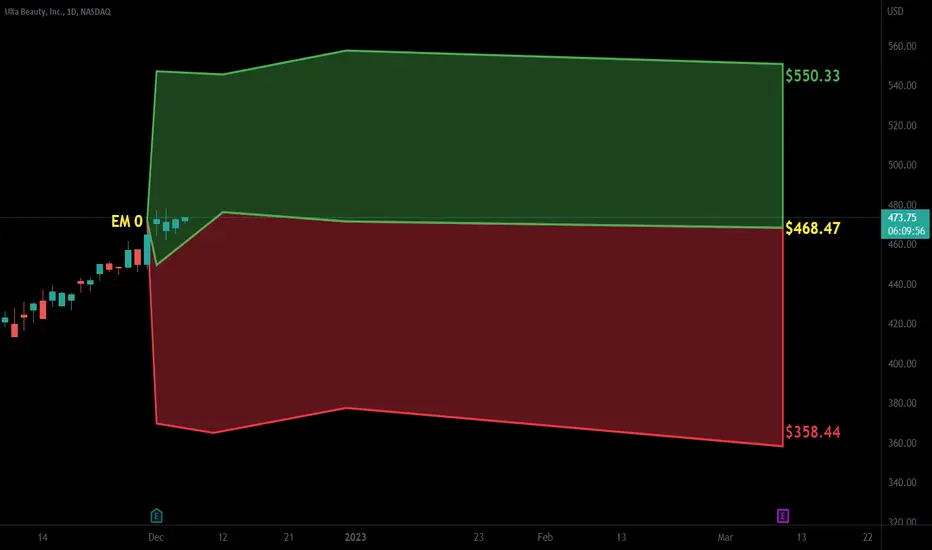
Earnings 12-1 AMCThis stock has been a true out-performer.
W pattern noted.
If price does not proceed much higher than where it is now, this could be a Alternate Shark. The last W for Ulta was a NEN star which reversed at the 1.272 of the entire structure.
Price is above a Rectangle and possible targets in green type.
EPS estimates last quarter was $5.70 a share which ULTA beat/This quarter the number to beat is $4.13.
Revenue last quarter was estimated at 2.3 Billion and they beat by 93 million.
This quarter the number to beat is 2.21 Billion.
Numbers appear to be soft.
Earnings day is usually when the market decides what will happen. I have always found this odd, but it is what it is. It is like a stock can be overvalued for eons, then earnings day comes and everyone sells it. Price can be in a Rising Wedge for months, then Boom, down she goes on earnings day.
No recommendation.
Price is above the .236 of the trend up since the covid low. Some resistance noted at the top of the last 3 long candles.

ULTA BEAUTY has had a long uptrend with good strength relative and excellent recent earnings.
On the chart, price has risen persistently and consistently
from a triple bottom in late September through October
The stay-at-home economy is over. Beauty and so cosmetics are back.
ULTA should benefit from holiday buying and gifting
Looking at long time frame charts. ULTA is now at its
all time high. nothing but blue sky above
Looks like a decent candidate for call options to me.

ULTA ShortTime to short ULTA. It has been going up since early November and RSI overbought on weekly and daily TF. Rising wedge as well as megaphone patterns are also noticeable.

12/15 WL 12/15 WL 🎄
$ULTA Calls >466.46/ Puts <456.37
⬆️PT:472.35⬇️PT: 453.88
$SBUX Calls >103.30/ Puts <100.70
⬆️PT:105.20⬇️PT:98.52
$BA Calls >189.67 /Puts <185.41
⬆️PT:191.11⬇️PT: 180.50
$BIDU Calls >120.35 /Puts <117.53
⬆️PT:121.81⬇️PT: 116.27

$ULTA with a Neutral outlook following its earnings #Stocks The PEAD projected a Neutral outlook for $ULTA after a Negative over reaction following its earnings release placing the stock in drift C with an expected accuracy of 100%.
Ulta Beauty (ULTA) - Breaking Out From Tight Flag On Dailies$ULTA daily chart - breaking out from tight flag pattern. Inside-day bar on Friday, allowing for tight stop to be placed.

Ulta Beauty (ULTA) - Tightening Up On Monthly Chart$ULTA monthly chart - almost at new all time highs. Tightening up considerably despite bear market. Daily chart (in thread) looking actionable.

Nen Star//RectanglePrice is at support and has met T1 of the crooked W pattern which looks like a bearish Nen-Star. Price is sitting on target 1. T2 is listed below. T3 would take price to the lower support line of the Rectangle.
Valley 2 of the harmonic structure is lower than valley 1.
Price is also in a large Rectangle which is a neutral pattern until a trendline is broken.
Some would swing trade inside the rectangle as it can bounce up and down inside of it for quite some time. It will eventually break down but can be a very long term pattern.
Green type above the structure are possible targets if there were a break of the upper trendline and orange type are possible targets down if bottom trendline is broken.
Short interest is around 3%.
No recommendation.
Price is still well above the .382 of the long trend up.

RectangleNew ATH today. No resistance overhead to speak of.
Possible Bearish Butterfly.
If this is a Butterfly, the last leg ends at the 1,272. The upward retracement is strict on the Butterfly and it must hit the .786 or very close to it.
The retracement leg (AB) up one nailed the .786.
It is a crooked W. There is a bullish Butterfly as well.
Butterflies can be found anywhere in a chart, but most often found at tops or bottoms.
This may not be a Butterfly so I am watching this one closely. If so, it will turn down soon.
The 1.618 is up there as sometimes this pattern can overextend. It is an extension and a reversal pattern.
This is not a Crab (ends at 1.618 or further in some cases) because the Crab retraces on the AB leg between the .382 and the .618.
This is also a rectangle, a large one. Price has broken the upper trendline. Strong stock.
Targets for a break to the upside are above the Rectangle and targets for a break to the downside are below it.
Doing nothing can be a good strategy.
No recommendation
Ulta Beauty last of retailers to feel consumer painWith other retailers reporting a tightening of consumer spending and rising energy and housing costs beginning to bite Ulta is demonstrating a megaphone top and approaching trendline resistance.
Trading on a PE Of 22 for a retail operation all off the good news may already be priced in and any slip on earnings will see it severely punished.
Watch for a reaction at trendline resistance.

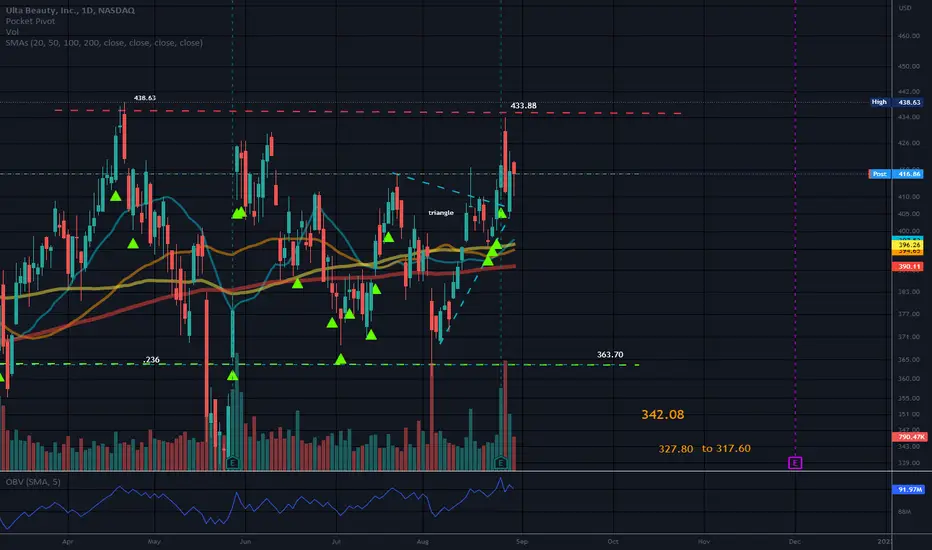
ULTA: might we see a breakout?The price action might break out of the rectangle pattern.
A price action above 404.00 supports such upside potential.
Further trend support above 416.00
Crossing above 423.00 might target 442.00.
Crossing below 410.00 will be the first sign of pending weakness.

RectangleA Market Darling.
ULTA is still above the .236 (bottom trendline of the Rectangle) of the impulse wave up.
Possible Double top unless price breaks out of the Rectangle and climbs to Targets in white above the Rectangle.
Targets for a break to the downside are in orange below the Rectangle.
Some would trade inside the horizontal trading channel.
It appears this stock is a money making machine, but I guess everything has a limit, maybe. I know I do.
Price is hanging on the top trendline of another Rectangle which is now support. The candle tail did dip lower but the bottom of the candle body is on the support line.t
These buyers have hung through thick and thin.
It will take an earthquake or a "come to Jesus moment" to panic these buyers in to selling this stock.
But they probably will eventually.
I noticed very soft earnings estimates by analysts next quarter which is not until 12/1/22.
They are predicting ULTA will beat their lowered earnings estimates.
Neutral pattern until a trendline is broken.
No recommendation.
Unbelievably resilient so far during a turbulent market, but I am not buying it here. I just heard CNBC Business Channel say it is a Buy so I looked.
US Stock In Play: $ULTA$ULTA - Consumer Cyclical | Specialty Retail
1yr of ranging price action, coupled with higher lows in RS where lows on price remains flat
latest ER beats by 0.71, beats on revs, comps of +14.4%; guides FY23 EPS and revs above consensus, raises FY23 comp guidance
remarkable

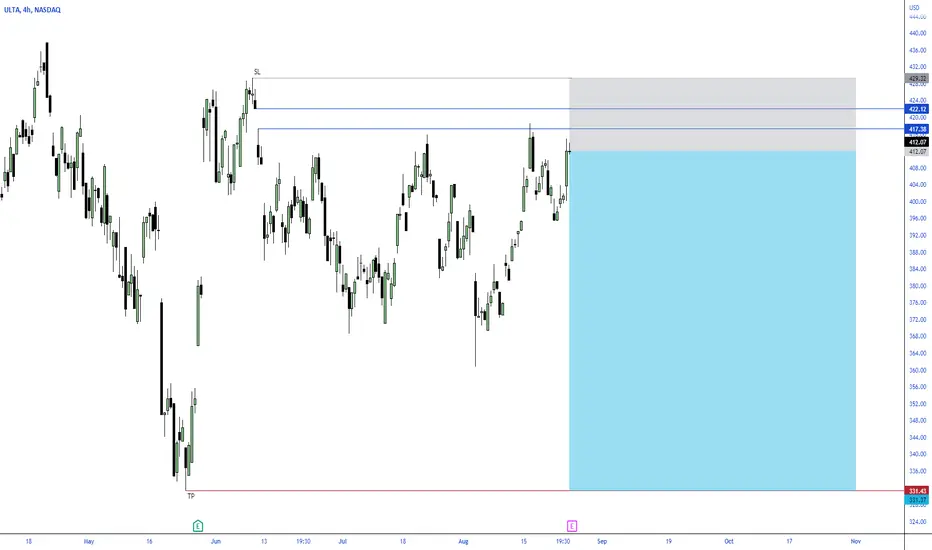
ULTA short possibilityInteresting structure here... looking to take some puts around 420 hopefully gaps up after ER can open position then.

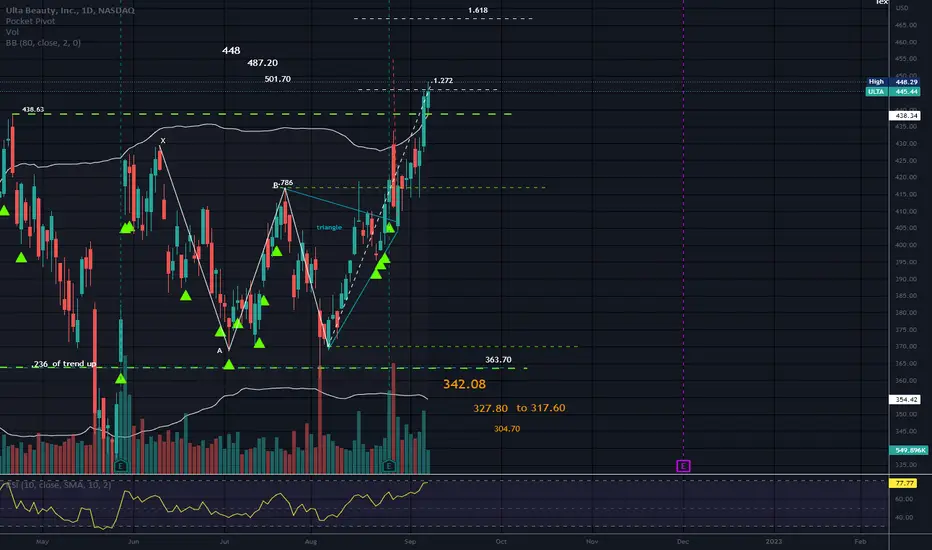
Amidst The World's Greatest Beauties Are Its RuinsULTA has been dodging fate for too long, anytime its indicated shorting opp. in 2022 it somehow finds new legs and treads higher. In my charts I use colors in accordance with their interpretation, so I didn't mean to paint this red it just only warranted red drawings, glamour stain tears goes with the pearls.. anyway:
- Nasty expanding triangle with Distribution, earnings as a catalyst to finally tank this (it needs a healthy pullback to continue growth over the years, good company, ugly chart)
- Bearish Harmonic more noticeable on the daily that indicates potential for pre-earnings run up to low 400s (around 410-413).. This would be ideal entry point for short position, looking at December puts
- Very similar setup to ULTA earnings in August 2019 (if you aren't familiar with its chart here is what happened: gap down from 330 to 230 on Earnings miss; this has seasonality based on the business and August report generally under-performs, especially when at reversal point w.r.t. chart structure, such as currently)
Expectations:
* Gap down following Earnings August 25th to the 295-330 range, followed by dead-cat bounce and continued downside
** Minimum Downside target by December 2022 is 223
*** If things get nasty it could get hit to 67 but I wouldn't bank on this because it will squeeze at some point after 223
#NFA
