$UPST Upstart Holdings Inc FLOAT SHORTED: 45.10%NASDAQ:UPST Upstart Holdings Inc FLOAT SHORTED: 45.10%
entry PTs 24.16 (Buy date: 20 Dec '23) --> 2nd entry PT 27.43 (Buy date: 18 Jan '24)
Target PTs 34 --> 24.16 --> 32.70 --> 27.43
Upstart Holdings, Inc., together with its subsidiaries, operates a cloud-based artificial intelligence (AI) lending platform in the United States. Its platform aggregates consumer demand for loans and connects it to its network of the company's AI-enabled bank and credit union partners. The company was founded in 2012 and is headquartered in San Mateo, California.
UPST trade ideas

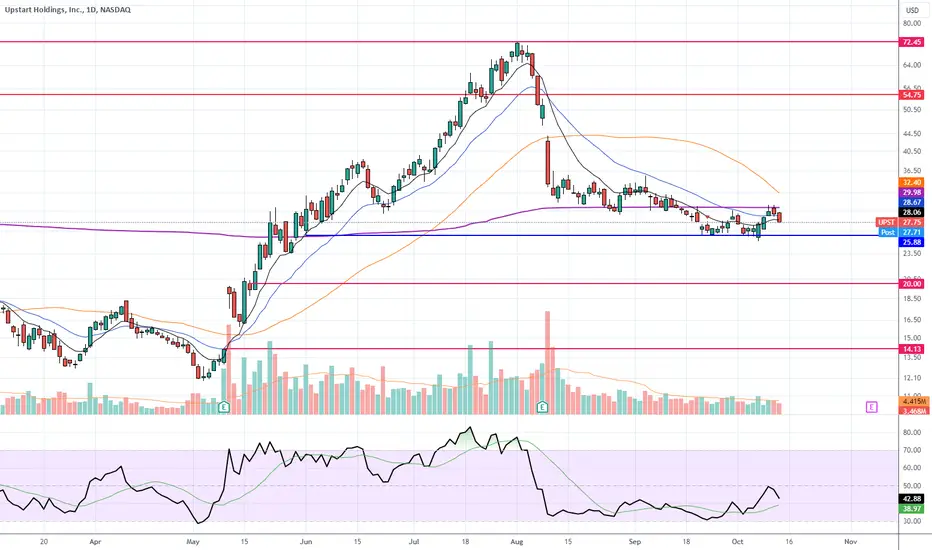
Patience is a virture #UPST banging on recovery #Happy Friday Patience is a virtue #UPST banging on recovery #Happy Friday
Big push on friday....is it short covering? is it more good news? lets recap this was our prior post
raring2go.substack.com

Upstart Holdings, Inc. (NASDAQ: UPST) Counteract The BearsShares of Upstart Holdings, Inc. (UPST) have been struggling lately and have lost 31.2% over the past week. However, a hammer chart pattern was formed in its last trading session, which could mean that the stock found support with bulls being able to counteract the bears. So, it could witness a trend reversal down the road.
The formation of a hammer pattern is considered a technical indication of nearing a bottom with likely subsiding of selling pressure. But this is not the only factor that makes a bullish case for the stock. On the fundamental side, strong agreement among Wall Street analysts in raising earnings estimates for this company enhances its prospects of a trend reversal.
Here's What Increases the Odds of a Turnaround for UPST
An upward trend in earnings estimate revisions that UPST has been witnessing lately can certainly be considered a bullish indicator on the fundamental side. That's because empirical research shows that trends in earnings estimate revisions are strongly correlated with near-term stock price movements.
Over the last 30 days, the consensus EPS estimate for the current year has increased 0.7%. What it means is that the sell-side analysts covering UPST are majorly in agreement that the company will report better earnings than they predicted earlier.

$UPST vs $PGY Are They Really Similar?Ever since its public market debut in 2022, investors have been constantly comparing Pagaya Technologies Ltd. (NASDAQ: PGY) and Upstart Holdings, Inc. (NASDAQ: UPST) since they are both AI-driven fintechs. However, there is no merit to this comparison due to both fintechs’ drastically different business models. Upstart works directly with consumers to provide them access to unsecured loans, while Pagaya works with banks to improve their lending capacities. With interest rates not expected to fall anytime soon, Pagaya’s business model appears to be more immune to macroeconomic headwinds than that of Upstart which is why investors could make gains by going long on PGY stock and short on UPST stock.
PGY & UPST Fundamentals
Business Model
The core of this article is Pagaya’s and Upstart’s business models. While both companies are AI-driven fintechs, they operate in very different ways. Pagaya’s business model is a B2B2C model where its clients use its AI platform to go through their initially declined loan applications to find good loans among them. Then, Pagaya bundles these loans and sells them to institutional investors in the form of ABS or to private investors.
This is a win-win-win situation for all parties involved. First, borrowers get the loans they need. Lenders add new customers, while taking no credit risk, as well as getting the majority of the upfront fees. Finally, ABS investors have their risk spread out across different sectors and different lenders while receiving a better return on the ABS since they pre-fund the loans Pagaya’s AI includes in the ABS.
As such, Pagaya realizes revenue from 3 fees which are AI integration fees charged to its partners, execution fees which are loan markups before they are put into ABS structures in addition to other fees for packaging the ABS, as well as contract fees which are charged to the private capital Pagaya manages to purchase loans.
In comparison, Upstart deals directly with consumers by acting as an intermediary between borrowers and lending partners. However, since these loans are considered as “second look”, Upstart’s partners don’t retain all of these loans on their balance sheet. Instead, Upstart bundles these loans and sells them as ABS, but still retains some of them on its balance sheet as according to its latest Q3 earnings report, it held loans worth nearly $1 billion.
While this is similar to what Pagaya does to an extent, there is a major difference in how both companies operate. Pagaya’s ABS are pre-funded, meaning that in case its partners don’t want to hold these loans it wouldn’t be left holding them on its balance sheet. This isn’t the same with Upstart since if its partners don’t want to hold the originated loans it is left holding them before bundling them and selling them as ABS. This is risky for a company with a weak balance sheet like Upstart as in case there’s a low demand for its loans, it would be burdened with the credit risk of these loans, unlike Pagaya which carries almost zero balance sheet risk.
Who Has The Better AI?
When it comes to each company’s AI, the results paint a good picture of who has the better capabilities. Pagaya is currently the number one personal loan ABS issuer by issuance size in the US as it raised more than $18 billion in ABS transactions since 2018 and $12 billion since 2012. In fact, its last four ABS issuances were oversubscribed by an average of 2 times, meaning that demand for its ABS was more than the available units. Furthermore, it added 6 new investors to its network since August, 2 of which have more than $400 billion in assets under management. This is a great indicator of the quality of Pagaya’s AI decisions as investors are rushing to pre-fund the loans processed through its platform without knowing the nature of the loans that will be included in the ABS.
Meanwhile, demand for Upstart’s ABS appears to be softening. In the 9 months ended September 30, the fintech reported that 53% of its loans were sold as ABS to institutional investors. This figure pales in comparison to 65% over the same period last year. Although Upstart bulls may attribute this to the worsening macroeconomic conditions, why are institutions still showing confidence in Pagaya’s ABS, knowing that they are pre-funded?
Another factor to consider is each fintech’s partners. Upstart’s largest partner is New Jersey-based regional bank Cross River Bank. Meanwhile, Pagaya just onboarded a top 5 US bank in terms of assets into its network along with a top 4 OEM captive finance company by US vehicle sales. The fintech is also in discussions with 80% of the top 25 US banks and has more than 10 opportunities across banks and auto captives that are in the later stages of business case development and onboarding.
The next factor in determining which AI is better is delinquencies. In the nine months ended September 30, Upstart’s charge-offs increased a staggering 53% YoY from $70.8 million to $108.1 million. At the same time, the fintech’s management shared in the Q3 earnings call that half of its auto loan book is taking on excess defaults and expects this to persist in Q4 as well.
However, Pagaya was quick to react to the macro headwinds by developing newer AI models that improve pricing by focusing on reducing delinquency rates which translates to higher returns for every incremental unit of underwritten risk. For instance, the company introduced an updated credit model in Q3 in its personal loan product that could lead to up to a .5% increase in annualized asset return. Therefore, it is no wonder that Pagaya was able to attract the top 5 bank and the top 4 OEM captive finance company to its platform in Q3. As such, it becomes clear that Pagaya takes the lead in terms of its AI capabilities.
Navigating Through Macro Headwinds
Based on both fintechs’ business models and AI capabilities, it is safe to assume that Pagaya is built to thrive in the current macro environment, while Upstart would only be able to rebound if macro conditions improve. In fact, looking at each company’s latest earnings call is enough to see the difference between both of them.
“Our ability to approve borrowers in this environment has remained the constraint on platform growth for most of the past quarter. On the funding side of our business, banks continue to manage balance sheets conservatively and seek to unwind existing asset positions in secondary markets.
Our underwriting of primer higher income borrowers has become more conservative over this past quarter, as their loss rates accelerate and converge with the broader default trends across the borrower spectrum. This has been a headwind for our volumes and fee revenues over this past quarter versus our contemplated guidance.”
UPST’s management in the Q3 earnings call.
“Our business is also benefiting from two structural macro tailwinds. First, banks are tightening their lending standards, pulling back on new originations as they face tight liquidity conditions, and increasing regulation. Additionally, private credit is increasingly stepping in the excess capital to deploying traditional banking assets.
Given Pagaya’s position in the ecosystem, we can offer an attractive solution to both lending institutions and asset managers. If these trends continue, all else being equal, we expect they will be supportive to our growth in the near term.”
PGY’s management in the Q3 earnings call.
The reason behind both tones is due to their vastly different business models unlike what many investors think. Since Upstart directly deals with borrowers, it has to maintain a marketing presence so that more borrowers would use its platform to receive their loans. Meanwhile, Pagaya doesn’t have to rely on marketing spend to increase its exposure. In fact, its marketing costs declined 56% YoY in the 9 months ended September 30th from $90.2 million to $40.1 million.
Instead, Pagaya relies on its partners’ customer acquisition costs since if more borrowers apply for loans at its partners, more loans would be processed through its platform. So for Upstart to grow, it has to increase its marketing spend, while Pagaya wouldn’t have to do so.
But even if Upstart ramps up its marketing efforts, its volume would still pale compared to Pagaya. In Q3, Upstart had an application volume of nearly $13 billion, and with a conversion rate of 9.5%, its transaction volume was $1.2 billion. On the other hand, Pagaya evaluated applications worth more than $182 billion in Q3, and its network volume was $2.1 billion at a very low conversion rate of less than 1%.
The difference in volume is simply incomparable. If Pagaya’s conversion rate increases once the macro conditions improve, its network volume could grow substantially which is why it might be better positioned to capitalize on any macro improvements in 2024.
Risks
It goes without saying that there are risks for any investment. The risk facing the bearish thesis on UPST stock is that since it is heavily impacted by macro conditions, its outlook may improve if the Fed starts cutting interest rates earlier than expected. Analysts expect this to happen in the second half of 2024, but if the upcoming CPI print shows that inflation is approaching the Fed’s 2% target, it could be a sign that rate cuts may be sooner than expected.
As for the bullish thesis on Pagaya, the main risk would be competition. Currently, there’s no platform similar to Pagaya. However, if large banks invest more funds into developing AI software, it could limit its revenue growth potential as it mainly depends on attracting major banks that process a huge number of transactions.
Technical Analysis
On the hourly chart, UPST stock is in a neutral trend as it is in a sideways channel between $19.94 and $22.43. Looking at the indicators, the stock is below the 200, 50, and 21 MAs which is a bearish sign. Meanwhile, the RSI is neutral at 45 and the MACD is bullish.
In terms of its fundamentals, UPST has been negatively impacted by the current macro conditions since it is dependent on loans originating from its platform. Therefore, the company reported underwhelming Q3 earnings in addition to slashing its guidance. Considering that the Fed is not expected to cut interest rates anytime soon, the company could continue suffering in the coming quarters from lower revenues and growing delinquencies which puts it a major credit risk since it holds around $1 billion of loans on its balance sheet. Based on this, investors could wait for the stock to test its $23 resistance. If the stock is unable to break this resistance, a good entry point for a short position could be between $23 and $22.
PGY & UPST Forecast
In summary, there is a misconception among investors that Pagaya and Upstart are competitors. As is, Upstart is mainly dependent on macro conditions as shown by its financial performance during this credit cycle. Meanwhile, Pagaya’s business model is more immune to macro conditions since it depends on its partners processing loans through its platform. Although both companies’ moat is their respective AI models, Pagaya’s is showing signs indicating that it is better performance-wise given the strong demand for its ABS compared to Upstart which shows that investors are more confident in Pagaya’s loans. Although improving macro conditions will benefit both companies, Pagaya has the potential to benefit more than Upstart due to its business model, which is why investors may find it profitable to go long on PGY stock and short on UPST stock.

$UPST High Leverage Could Be Its DownfallAs we’re heading into earnings season, one report investors are anticipating is fintech startup Upstart Holdings, Inc. (Nasdaq: UPST). While the startup beat analysts’ expectations in its Q2 earnings, its stock is down 45% since then due to an underwhelming guidance resulting from macroeconomic pressures. With the fintech holding $837.5 million in loans on its balance sheet and delinquency rates rising near pre-pandemic levels, Upstart may suffer in the coming quarters as the macro conditions aren’t expected to improve anytime soon. In light of this, we’re downgrading our earlier hold rating on UPST stock to a sell.
UPST Fundamentals
Too Many Macro Challenges
Since inflation skyrocketed and the Fed started hiking rates, Upstart has witnessed fewer loans to approve. This resulted in its volume plunging, taking revenue and profits along with it. Originally, one of the fintech’s main attractions was that it doesn’t have the same exposure to economic fluctuations since it isn’t a bank. However, this view has been proven wrong by its financial performance this year as loan originations across its platform declined 64% YoY in Q2 to 109,447 loans totaling nearly $1.2 billion. This slow demand for loans has led the company’s revenues to decline 54.4% YoY in the first half of the year.
This headwind may continue impacting Upstart in the near term since while the Fed held interest rates flat in recent meetings, it signaled that it could further hike rates if inflation remains high. This would hinder the economy by curbing demand for new loans, and as a result, further impact the company’s ability to generate revenue. It is for this reason that Upstart may report underwhelming Q3 earnings on November 7th, especially since the average interest rate in Q3 was 5.42% compared to 5.17% in Q2. Additionally, high interest rates could lead to more delinquencies in the future which would severely impact the company in my opinion.
Upstart’s aim is to provide borrowers with fair credit – of at least 600 – access to personal loans by looking beyond their credit history. Instead, the fintech considers other non-traditional credit indicators like college education, job history, and residence. As a result, its platform is considered a good option for customers who don’t have a credit score that qualifies them for more inexpensive loans. In exchange for providing such a service for these consumers, Upstart charges origination, late, unsuccessful payment, and paper copy fees.
During the current macro environment, banks have been tightening their lending standards for both businesses and households, and they anticipate maintaining this cautious approach for the rest of the year, according to a survey conducted by the Fed. As such, lower quality borrowers or “subprime” borrowers that real banks don’t want have to lean on platforms like Upstart for their personal loans.
With that in mind, delinquency rates in the US are on the rise with them approaching pre-pandemic levels at 2.36% for all loans, according to latest data from the Fed. Meanwhile, delinquency rates (60 days or more past due) for personal loans reached 3.62% in Q2, according to LendingTree. Considering that subprime borrowers are more likely to miss payments or default on their loans than borrowers with better credit, Upstart appears to be in a tough position, especially with the resumption of student loan repayments last month.
To fully understand the extent of this on Upstart, investors should note that during the first half of 2023, 38% of the loans funded through its platform were retained by its lending partners, and 50% of the loans were sold to institutional investors through its loan funding program. Meanwhile, the company retained 12% of the loans originated through its platform.
This represents an increase from the 10% it retained at the end of 2022 which shows that institutional investors as well as its partners are becoming more cautious about purchasing its loans. If this trend continues in the coming quarters, it would represent a major threat to the company due to its weak balance sheet.
Risky Actions May Backfire
While banks are negatively impacted by high interest rates due to higher delinquency and default rates, they also benefit from them due to the higher interest they charge on their loans. This isn’t the case with Upstart since it isn’t a bank. While the startup started carrying around $1 billion in debt on its balance sheet, its balance sheet isn’t strong enough to handle this risk, especially since it only has $443.6 million in cash on hand.
As is, Upstart is dependent on funding from its partners to fund the loans originated through its platform. Earlier this year, the fintech secured $2 billion in funding over a 12-month period from its partners to support its loan originations.
Moreover, the startup isn’t profitable yet and is barely generating operating cash flow as it generated only $86.6 million from operations in the first half of the year. This means that in case the loans it’s holding on its balance sheet go sour, there might be risks surrounding its ability to continue operating.
However, the biggest risk facing Upstart may be the contractual derivative risk in its committed capital partnership where it is forced to invest capital with its partners, exposing its capital to exposure of losses on a larger pool of loans its partners are purchasing. The company describes this investment as “beneficial interests” in its Q2 earnings report. This arrangement may appear similar to holding ABS securities, however, ABS securities have a yield spread protecting the equity, which is not available in this arrangement.
In Q2, Upstart reported that it had $40.2 million invested in risk-sharing as part of its committed capital arrangements to support $742.9 million in loans. As this amounts to an 18:1 leverage ratio, the company’s equity would be hit hard in case of losses on this investment. Currently, the company projects this investment to be worth $51.7 million with the potential to be worth between $0 and $83.4 million over time, dependent on future credit performance.
Given that delinquency rates are on the rise as mentioned earlier, the company may see a loss on its investment if the economy takes more than anticipated to normalize. As is, the Fed projects the federal funds rate to be around 5% at the end of 2024, as shared in the Summary of Economic Projections last month.
At the same time, it remains unknown whether the company will invest more capital to support committed originations. In that case, its balance sheet will be burdened with a lot of highly leveraged exposure amid a possible recession next year.
Valuation
In terms of valuation, we can start with the value of the company’s balance sheet. At the end of Q2, Upstart had $1.76 billion in assets and $1.12 billion in liabilities. This means that the net value of its assets is $638.14 million which puts its P/B ratio at 3.83. With that in mind, value investors prefer the P/B ratio to be under 3 which could indicate that the stock may be overvalued at its current valuation.
Assets $1,763,712,000
Liabilities $1,125,567,000
Net Assets $638,145,000
OS 83,887,658
BVPS $7.61
Share Price $29.17
P/B Ratio 3.83
Since Upstart is unprofitable, we can also use forward P/S to value its shares. Typically, investors prefer this ratio to be below 2, however, they may pay more for fast-growing companies. Currently, Upstart is trading at 4.6 forward P/S, and while it may not seem to be an unreasonable valuation, the company’s revenues are declining substantially as it reported a 44.3% YoY revenue decline in Q2.
Based on these metrics, a $15 price target could be given to UPST stock, implying a 50% downside from current levels.
Upside Risks
Despite the bearish thesis on UPST stock, there are upside risks that investors should consider. If the Fed starts cutting rates earlier than anticipated, the company may be well-positioned to see a positive return on its risk-sharing arrangement which could bolster its financial position. Moreover, institutional investors and the fintech’s partners may increase the amount of loans they purchase which would decrease the amount of loans it carries on its balance sheet – reducing credit risk.
Upstart’s loans have been performing better in recent quarters. While the fintech’s loans were underperforming in 2021 and 2022, the expected gross realized returns increased from 3.5% in Q1 2022 to 11.5% in Q1 2023, according to its Q2 earnings presentation. If the company’s loans continue demonstrating strong performance, banks may become more willing to work with it.
Technical Analysis
On the hourly chart, UPST stock is in a neutral trend as it is trading in a sideways channel between $25.82 and $30.62. Looking at the indicators, the stock is above the 200, 50, and 21 MAs which is a bullish sign. Despite this, the RSI is overbought at 82 and the MACD is curling bearishly, indicating a possible reversal in the trend soon.
As for the fundamentals, Upstart’s upcoming Q3 earnings report on November 7 is a major catalyst as it will determine the extent of the macro environment’s impact on the fintech’s operations, as well as shedding light on its risk-sharing agreement. Since there has not been much improvement in the macro environment in Q3 compared to Q2, it is likely that Upstart will report another underwhelming earnings report.
Given that the stock is trading near resistance, investors may find the current PPS a good entry point to start a short position in the stock ahead of its Q3 earnings. Take profits could be found on retests of the $25 support, $22 support, and $15 price target with a stop loss near $32.2 if it breaks resistance.
UPST Forecast
After looking more into Upstart’s Q2 results, we decided to revisit our earlier hold rating on UPST stock. As is, the macro environment is proving to be too difficult for the fintech to operate due to the rising delinquency rates which has led to the company retaining a larger portion of the loans it originates. Currently, the startup is holding loans worth $837.5 million on its balance sheet which could be a ticking time bomb if the trend of rising delinquency rates continues in the coming quarters. This could also impact the $40.2 million invested in risk-sharing as part of its committed capital arrangements. If this figure increases in the upcoming Q3 earnings report, the startup’s balance sheet would be exposed to high leverage in the midst of a recessionary environment, which doesn’t bode well for it since its balance sheet is already weak. Given our $15 price target on UPST stock, taking a short position in the stock may prove to be a profitable decision.

UPST Upstart Holdings Options Ahead of EarningsAnalyzing the options chain and the chart patterns of UPST Upstart Holdings prior to the earnings report this week,
I would consider purchasing the 30usd strike price Calls with
an expiration date of 2024-3-15,
for a premium of approximately $7.25.
If these options prove to be profitable prior to the earnings release, I would sell at least half of them.
Looking forward to read your opinion about it.

$UPST: struggling at 30Looking at UPST and broader growth financials is a bit of a concern here. UPST has fallen sharply from the $70+ high and may continue to fall towards 20 here over time. We'll see. Good luck traders.

UPST ready for growth?Looks like UPST is breaking out of the trend and ready to show some growth over the coming months. Looks like the 2023 earnings will be the worst and then more positive earnings for 2024 based upon analyst models. The RSI is at 40 for this company and volume is a 5,879,439. The stock is consolidating on support of the 200 ma a moving into a new trend. There is a gap to fill from its drop in August 2023.

Monitor for entry - #UAW #AUTO
NASDAQ:UPST Monitor for entry
Picture yourself in that showroom, eyeing that sleek new Ram or Ford truck. You may work for a big corporation, or perhaps you're one of the many self-employed folks out there. And there's that finance guy, wearing a friendly smile, ready to talk numbers.
When it comes to making that big purchase, financing often becomes a crucial part of the equation.

UPSTI've had puts in this name for a couple weeks now anticipating the VWAP from May 2022 earnings to be broken (purple line). Finally starting to see that now. Took some profit yesterday but ultimately looking for that gap around $14-15 to get filled or at least touch inside the gap.

UPST's Current Correction Offers a Second Chance Buy OpportunityUPST had a strong bullish rally from May 1 to July 31 with the stock price rising from $13 to $74 (marked by the green and red arrows).
However, economic conditions are hurting the lending market and UPST reported lower forecasts for the current quarter. This has led to a strong selloff at $74 that has dropped UPST down below $30.
I think that this dip is worth monitoring to profit from UPST's next rally. I'm keeping an eye on the two yellow trendlines as key support levels for a potential bounce. UPST has dropped below the $29.19 support level already and I have my eyes on the lower yellow support level at $24.10 for a bounce somewhere between these two yellow trendlines. I'm monitoring the price action to look for a sign of reversal here, and I will post an update when UPST presents a buy opportunity.
When UPST does have a bounce I would keep an eye on the blue trend line as a short-term price target at $38.37.

Will UPST present an long opportunity in next two weeks?UPST retraced almost 60% from the top on August 4th 2023. I think it is at stage where it gets some stability this month.
$24.75-$27.35 might present an entry point, If it doesn't hold at these levels then $21.61 might be a support area.
Upside targets are $34 and $37.

new long trigger for UPST🚀🟢boost and follow for more...thanks 💜 June 1st I said "We called the triple bottom bounce, trend breakout and even gave long trigger at 22 if you missed the dip entry 🔥,After 35 a rally to 50 is possible "
lovely 200%+ rally from my long trigger, congrats to longs! (200% on shares, options probably did 1000-2000%) 💰
Currently in consolidation above important pivot level, and RSI is now at oversold levels.💪
I'm setting a new long trigger at 36.5, if we break higher from consolidation it should be explosive and I expect a quick push to 41-51-70 shortly after 🎯

Get ready for $20- $21There's nothing bullish about this chart, despite what others claim. Protect your capital and wait for price to get right into the area between the two pink lines.

UPST 1H ( Bullish Scenario )UPstart Holding in the 1-hour timeframe is showing good conditions for growth. If the price drops slightly and gets confirmed, you can enter a Buy trade

Short Trade in UPSTTalk about a fall from grace…
After rallying 460% from May to August, the high-tech automotive finance company fell 57% in a week!
The stock was murdered.
Yet, even at half off, investors are not enticed to buy. UPST cannot rally – a clear sign that institutions have no interest in the stock.
This is Stage 3 action (heavy institutional selling), and I would be shocked if the stock did not continue lower in a prolonged Stage 4 decline.

$UPST - potential Buy stockNASDAQ:UPST announced its earnings on 8 August, 2023.
About Company
Upstart is a leading AI lending platform partnering with banks to expand access to affordable credit.
Fundamental analysis:
The company beat expectations by 900.00% while revenue fell 40.50% compared to the same quarter a year ago.
Technical analysis:
$28-$30 area is decent support zone.

UPST Short Squeeze Could be a dead cat. But the RR is great. UPST is currently under attack my shorts, and they have been BURNED by this stock. Nevertheless, they'll need to take profits soon, after UPST is in a clear panic sale. This bubble stock has high volatility, so trade accordingly. NASDAQ:UPST

UPSTART Stock Chart Fibonacci Analysis 081423 Trading Idea
1) Find a FIBO slingshot
2) Check FIBO 61.80% level
3) Entry Point > 31.1/61.80%
Chart time frame : B
A) 15 min(1W-3M)
B) 1 hr(3M-6M)
C) 4 hr(6M-1year)
D) 1 day(1-3years)
Stock progress : A
A) Keep rising over 61.80% resistance
B) 61.80% resistance
C) Hit the bottom
D) Hit the top
Stocks rise as they rise from support and fall from resistance. Our goal is to find a low support point and enter. It can be referred to as buying at the pullback point. The pullback point can be found with a Fibonacci extension of 61.80%. This is a step to find entry level. 1) Find a triangle (Fibonacci Speed Fan Line) that connects the high (resistance) and low (support) points of the stock in progress, where it is continuously expressed as a Slingshot, 2) and create a Fibonacci extension level for the first rising wave from the start point of slingshot pattern.
When the current price goes over 61.80% level , that can be a good entry point, especially if the SMA 100 and 200 curves are gathered together at 61.80%, it is a very good entry point.
As a great help, tradingview provide these Fibonacci speed fan lines and extension levels with ease. So if you use the Fibonacci fan line, the extension level, and the SMA 100/200 curve well, you can find an entry point for the stock market. At least you have to enter at this low point to avoid trading failure, and if you are skilled at entering this low point, with fibonacci6180 technique, your reading skill to chart will be greatly improved.
If you want to do day trading, please set the time frame to 5 minutes or 15 minutes, and you will see many of the low point of rising stocks.
If want to prefer long term range trading, you can set the time frame to 1 hr or 1 day.

UPST is coming 1.UPST is strong rejected from tp1 as i expected
but as of now retraced
2 it's another goood buy entry
near $27 this is strong key price ( red line )
3. next tp3 is marked on the chart $140 after break 70 ( also strong R )

$UPST relief rally?NASDAQ:UPST price action indicates that there might be a relief rally coming soon.
1. Inverted hammer on daily
2. Two candles outside the lower end of BB
3. Bullish divergence on daily and 4h
I could see this testing the 28-30 levels but should see a decent pump form here. I would wait few more days to consolidate/form the bottom

Upstart Squeeze over?Upstart has completely fallen from the skies.
I took a small speculative long play today at the lows...sizing for loss.
Will this buy now pay later company, bounce now or bounce later?
Even crappy companies see technical bounces.
