Veru LongVeru a broken out of a falling wedge pattern, which it has also retest.then creating higher highs and higher lows in a channel from its over all dominant bullish inverted double bottom Patterson the 4 hour. I think public participation is on the way.
VERU trade ideas

VERU having an Alpha candle todayIt has some upside potential. One the candle, second being close to .80c mark. There is something with this price, moves happen exponential. Guessing 1.04 to 1.20 range target. Do not quote me on this, just an estimate
VERU: Buy ideaBuy idea on VERU as you see on the chart because we have the breakout with force the resistance line by a big green candle.Thanks!

VERU Options Ahead of EarningsLooking at the VERU options chain ahead of earnings , I would buy the $10 strike price Calls with
2023-4-21 expiration date for about
$0.60 premium.
If the options turn out to be profitable Before the earnings release, I would sell at least 50%.
Looking forward to read your opinion about it.

Squeeze on watchVERU has a huge volume gap, 23% short float, cup and handle on the daily, with earnings coming up within 3 weeks. Might see some covering going into earnings.

AnalysisAs you see on the chart the resistance line and the support line converge. This style of chart shows us that sellers are finding it increasingly difficult to sustain their efforts. It is a pattern of running out of a bearish movement.Thanks.

Weekly rising trendVeru is going to touch its rising trend which comes from April 2019.Whenever it touches that line it bounced following weeks. If fda approval comes for EUA, it may go above $25 in a short time. The company already have 2 more drugs approved by fda. Best time to buy under $6 now. Thursday closed at $5.91
RSI

LONG , DAILY TREND AT VERUIf yıu look at daily graph of #Veru , you can see it tocuhes daily trend line. I tried to show you in circles, whenever it touches to trend line it jumps up and make new top.
Price is $6,59 now and the first resistence area is between $8,50 - $10
I buy Veru shares from this level and wait some time to make profit. $VERU #VERU
Good Luck

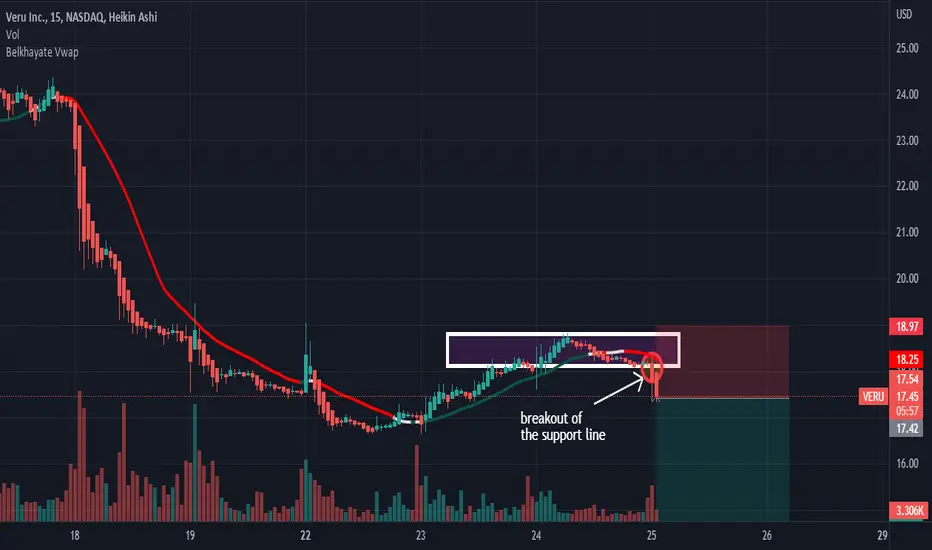
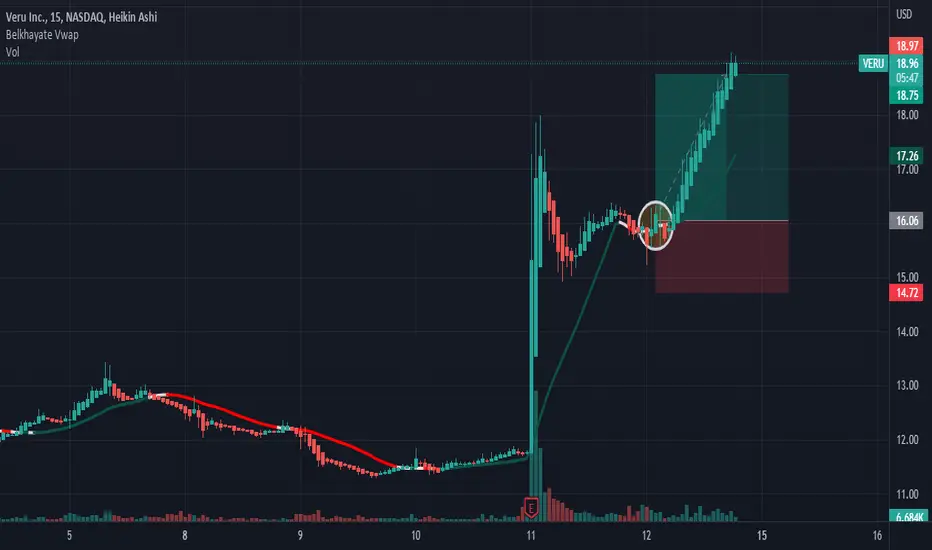
Continuation of uptrendHi.. As you see on the chart we will have a continuation of uptrend after the breakout with force the vwap indicator and the resistance line by a big green candle with a large green volume., In other hand, if the support line is broken it's mean that we will have a reversal trend.Thanks.

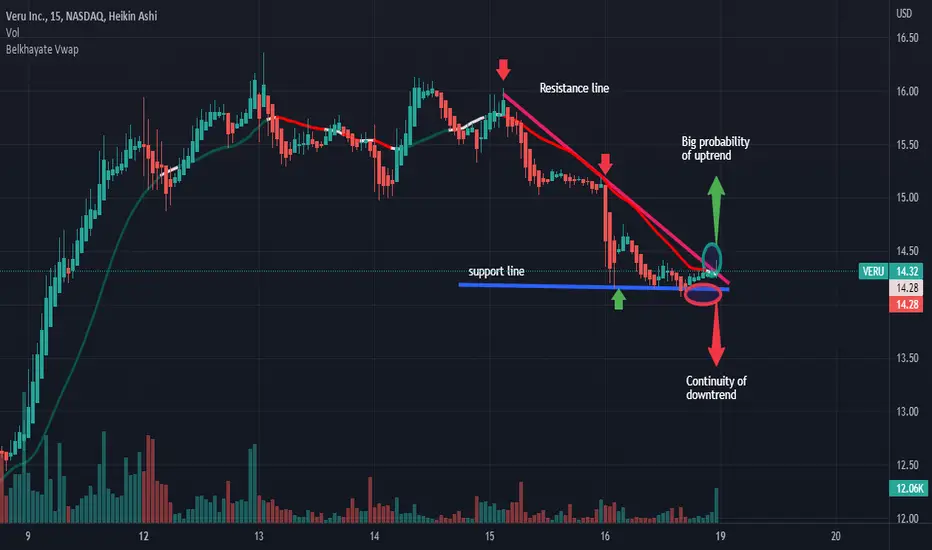
Continuity of a downtrendGood morning all!! On VERU we will have a big probability of a downtrend as you see on the chart. But, if the resistance line is broken with force by a big green candle with a large volume it's mean that we will have a reversal trend. Thanks. Good day...!

Analysis-Big probability of a downtrendAs you see on the chart we will have a big probability of a downtrend after the breakout with force the vwap indicator and the support line by a big red candle with a large volume. In other hand we will have a continuity of an uptrend after the breakout with force the resistance line by a big green candle with a large volume.Thanks.

Analysis-Big probability of a downtrendHello! As you see on the chart we will have a big probability of a downtrend because we see a good candle with a long wick and small body with also a large volume so it's mean that sellers are pushing buyers away.Thanks.

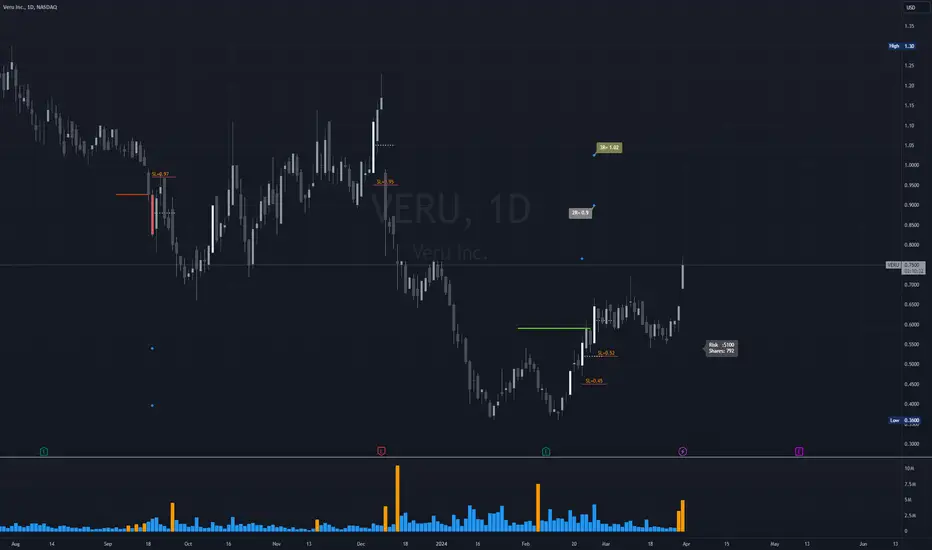
AnalysisAs you see on the chart if the resistance line is broken with force by a big green candle with a large volume we will have a big probability of an uptrend. But if the support line is broken by a big red candle with a large volume we will have a continuity of a downtrend.Thanks.

Analysis-Big probability of uptrendHello! As you can see on the chart, we are in a downtrend and we are not going against this trend. Looking at the chart pattern we have a high probability of having an uptrend if and only if the resistance line is forcefully broken by a large green candle and followed by large green volume. Alternatively, we might have a downtrend continuity if the support line is forcefully broken by a large red candle and followed by large red volume.Thanks!
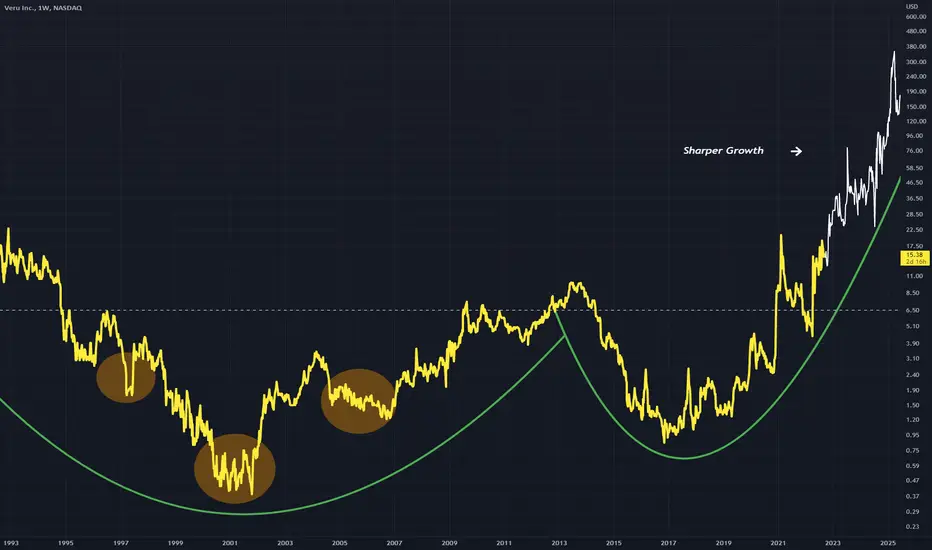
VERU - Cup and Handle Leading to Sharper Growth A large Cup and Handle formation encompassing the entire price history
This handle situation may continue and lead price to sharper rises
An inverted Head and Shoulders pattern can also be identified within the Cup structure
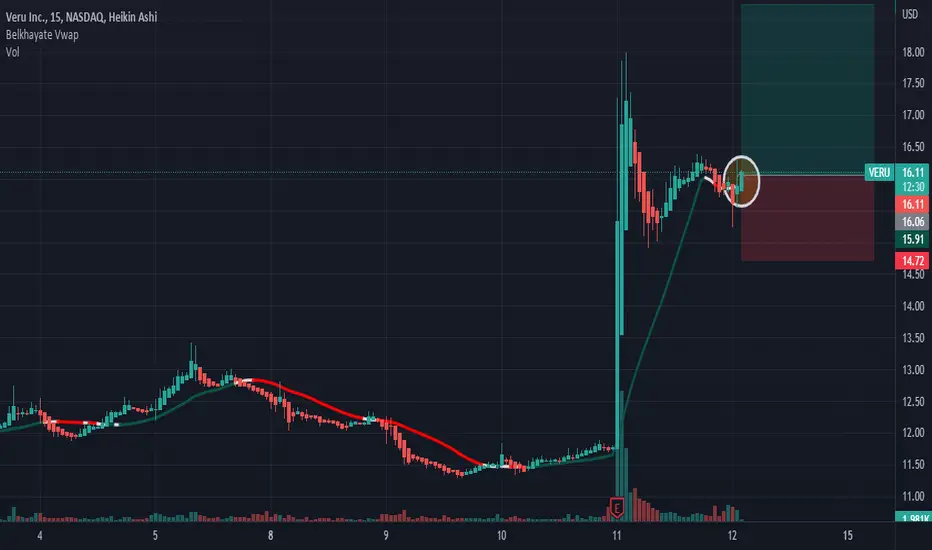
Possibility of reversal trendAs you can see on the graph the buyers are trying to approach the vwap indicator little by little. This means that we could have a trend reversal however if the vwap indicator is broken forcefully by a large green candle and accompanied by large green volume. But let's be patient so that all the conditions are met.Thanks.

Analysis-Big probability of an uptrendAs you see on the chart we have the breakout of the vwap indicator, it's mean that we will have a big probability of an uptrend. In other hand, if we have the breakout also of the resistance line we can double our buying position. But, we can have also a continuation of a downtrend if we have the breakout with force the vwap indicator and the support line.Thanks.

AnalysisOn this stock, we have a breakout of the support line and also we are under of the vwap indicator so we will have a big probability of a downtrend.Thanks.
Pullback-uptrendPullback on the vwap indicator and the support line so it's mean that we will have a big probability of an uptrend.Thanks.

AnalysisAs you can see on the chart, we are above the vwap, ie we are in an uptrend. Looking at the chart pattern, we have a high probability that the market will go down if the support line as well as the vwap are forcefully broken by a large red candle and accompanied by large red volume. But, let's keep an eye out because we could have a continuation of the uptrend if the resistance line is broken forcefully by a large green candle and followed by large green volume.Thanks for your attention!

VERU +50%/-35%Very volatile stock, because it’s health technology.
So we see the flag after a strong impulsive move, and we should waiting for the break cause it can go up or down the same way.
