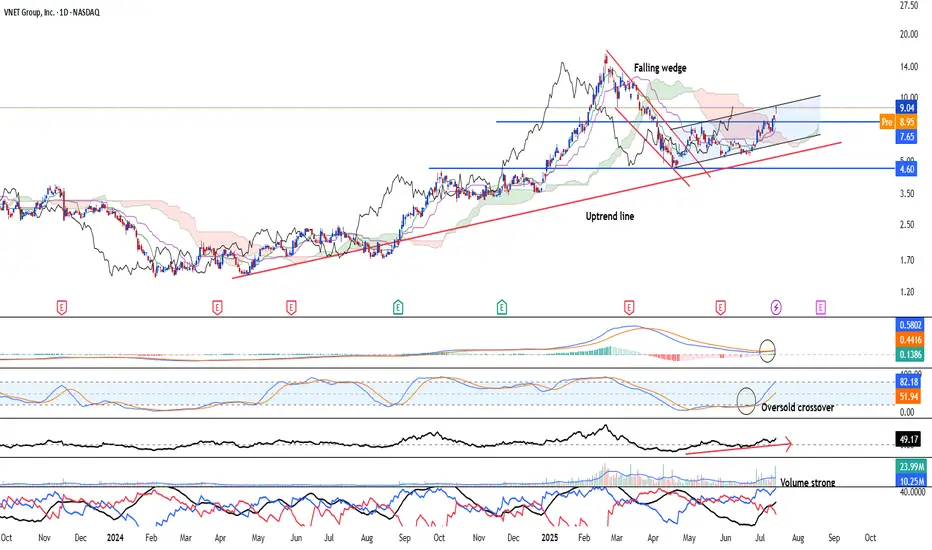
Vnet Group - Bullish trend in an early stage NASDAQ:VNET is looking at an early bullish trend continuation after the stock has broken out of the falling wedge and forms a pair of higher high and higher low. Uptrend remain intact since April 2024. Stock is likely to see strong upside going forward.
Long-term MACD just see a crossover. and hi
Next report date
—
Report period
—
EPS estimate
—
Revenue estimate
—
0.07 USD
23.36 M USD
1.15 B USD
253.41 M
About VNET Group, Inc.
Sector
Industry
CEO
Sheng Chen
Website
Headquarters
Beijing
Founded
1999
FIGI
BBG001M32Y18
VNET Group, Inc. operates as a carrier- and cloud-neutral internet data center services provider in China. It provides hosting and related services, including IDC services, cloud services, and business VPN services, to improve the reliability, security, and speed of its customers' internet infrastructure. The firm serves numerous industries, ranging from internet companies to government entities, blue-chip enterprises to small- and mid-sized enterprises. VNET Group was founded by Sheng Chen and Jun Zhang in 1999 and is headquartered in Beijing, China.
Related stocks
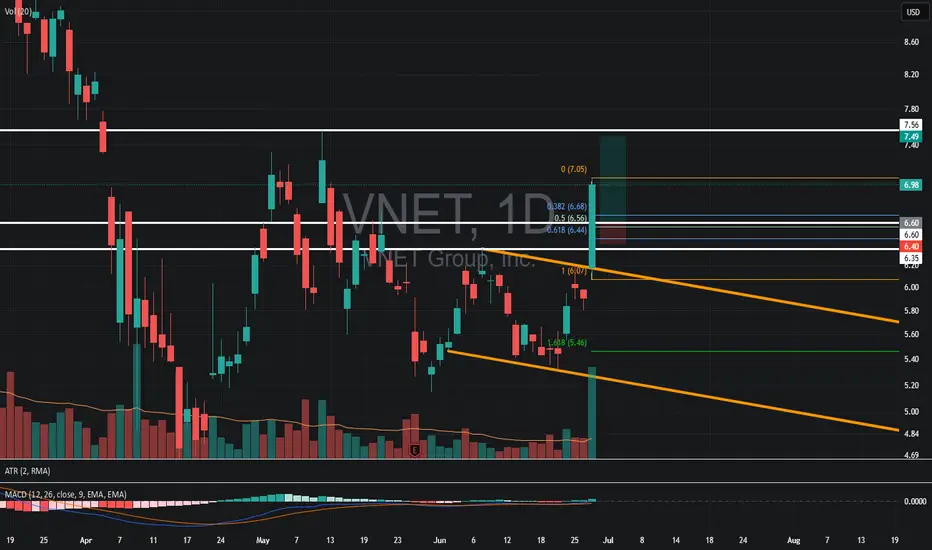
VNET – Watching for a Pullback Buy OpportunityWhy It's on My Radar:
Just broke out of a downward channel with solid volume
MACD curling up — bullish crossover setting up
Not trying to catch a falling knife here — waiting patiently for a clean pullback.
Key Level I’m Watching:
~$6.60 → lines up closely with the 0.50 fib retraceme
VNET china name that can pay niceNASDAQ:VNET got hammered due to the regulation talk. Reversing here and can rip over $24

+37% profit on VNET , Did you get some?It takes a lot to make money in the stock market More than nice charts .
This thing has potential to go higher and it could go lower too , so play it safe always .
#Stay_safe .
Trader K


VNET, price exceeded its 50-day Moving Average on Oct 08, 2020This price move could indicate a change in the trend, and may be a sell signal for investors. Tickeron A.I.dvisor found 46 similar cases, and 42 were successful. Based on this data, the odds of success are 90%. Current price $23.07 crossed the support line at $22.76 and is trading between $23.52 sup

$VNET can rise in the next daysContextual immersion trading strategy idea.
21Vianet Group, Inc. provides carrier and cloud-neutral Internet data center services to Internet companies, government entities, blue-chip enterprises, and small-to mid-sized enterprises in the People's Republic of China.
The demand for shares of the co


21Vianet Announces US$20 Million Share Repurchase ProgramVNET: 21Vianet Group, Inc.
2019-12-04 06:30:10
21Vianet Announces US$20 Million Share Repurchase Program


See all ideas
Summarizing what the indicators are suggesting.
Neutral
SellBuy
Strong sellStrong buy
Strong sellSellNeutralBuyStrong buy
Neutral
SellBuy
Strong sellStrong buy
Strong sellSellNeutralBuyStrong buy
Neutral
SellBuy
Strong sellStrong buy
Strong sellSellNeutralBuyStrong buy
An aggregate view of professional's ratings.
Neutral
SellBuy
Strong sellStrong buy
Strong sellSellNeutralBuyStrong buy
Neutral
SellBuy
Strong sellStrong buy
Strong sellSellNeutralBuyStrong buy
Neutral
SellBuy
Strong sellStrong buy
Strong sellSellNeutralBuyStrong buy
Displays a symbol's price movements over previous years to identify recurring trends.