$VRA, one more retest of $6-7 range, sets up long-term uptrend$VRA has been in a bear market for the last 9-10 years. As with many value stocks, it's looking primed for a trend reversal.
It looks like we should get one more retest of the lows at $6.16-$7.67 in April-May which should setup the chance to break out of the downtrend channel.
Upside = Moon
Next report date
—
Report period
—
EPS estimate
—
Revenue estimate
—
−2.61 USD
−62.19 M USD
371.97 M USD
18.29 M
About Vera Bradley, Inc.
Sector
Industry
CEO
Jacqueline Ardrey
Website
Headquarters
Roanoke
Founded
1982
FIGI
BBG000R50SY9
Vera Bradley, Inc. engages in the business of designing women's handbags, luggage, travel items, fashion, home accessories, and unique gifts. It operates through the following segments: Vera Bradley (VB) Direct, Vera Bradley Indirect, and Pura Vida. The VB Direct segment is involved in selling VB products through full-line and factory outlet stores, websites, online outlet site, and the VB annual outlet sale. The VB Indirect segment includes distribution of branded products to specialty retailers, select department stores, national accounts, third-party e-commerce sites, third-party inventory liquidators, and licensing agreements. The Pura Vida segment focuses on distributing products to wholesale retailers. The company was founded by Barbara Bradley Baekgaard and Patricia R. Miller in 1982 and is headquartered in Roanoke, IN.
Related stocks


VRA - Small downside, Large upsdie, bouncing on oversold RSI. I've been watching this one for a few days. It historically bounces off the 35% - 25% RSI mark, and is approaching 30% right now with a turn upwards starting - You can see it in the MACD as well as the momentum and moving average are about to cross. I am entering 11/20/2020 $5 calls with stop losses

Price action & Psychology - Resistance, consolid., continuationHello !
Key points :
Resistance broken on high volume and wide range candles
Consolidation phase and support hold
Huge price rejection on the hourly + high volume
Relative strength (compared to today's market conditions)
I've left some charting from the previous trade on this analysis, to

Price action & Psychology - ABCD Pattern, what's next ?Hello !
Key points :
New trend starting after ABCD pattern
First pullback occuring on 50% retracement
Volume on uptrend is higher than downtrend
Consolidation taking place
ABCD Pattern
This isn't a quite regular ABCD pattern, even though the time between AB and CD is almost equal (or ne

$VRA Golden Cross in Vera Bradley Entry level $11.80 = Target price $13.25 = Stop loss $11.45
Golden cross buy signal complete.
Indicators all bullish.
Long term channel well respected, next move to the top.
Short interest 8%.
Company profile
Vera Bradley, Inc. designs, produces, markets and retails accessories for women. Its produc

VRA Earnings PlayDoes anyone buy Vera Bradley junk anymore? Seems out of fashion, especially wit the younger crowd.
Betting they miss, small bet, bought $12.5 puts this morning, so I need $11.5 or lower to make money....

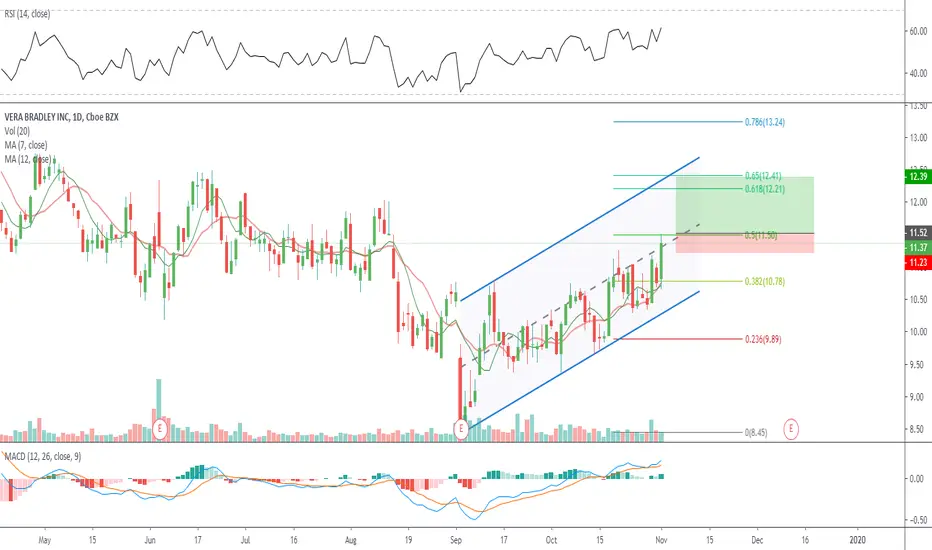
$VRA Vera Bradley trade setupEntry level $11.50 = Target price $12.39 = Stop loss $11.25
8.78 % short interest.
24.40 P/E ratio
Company profile
Vera Bradley, Inc. designs, produces, markets and retails accessories for women. Its products include handbags, accessories and travel and leisure items. The company operates through tw
VRA- Vera Bradley Weekly ChartWider look on VRA with a Weekly chart. Price back on its former trading range. Still in a downtrend NASDAQ:VRA

VRA- Vera Bradley Daily ChartPrice is back on its 8.30 to 9.50 range. Neutral at the moment NASDAQ:VRA

See all ideas
Summarizing what the indicators are suggesting.
Neutral
SellBuy
Strong sellStrong buy
Strong sellSellNeutralBuyStrong buy
Neutral
SellBuy
Strong sellStrong buy
Strong sellSellNeutralBuyStrong buy
Neutral
SellBuy
Strong sellStrong buy
Strong sellSellNeutralBuyStrong buy
An aggregate view of professional's ratings.
Neutral
SellBuy
Strong sellStrong buy
Strong sellSellNeutralBuyStrong buy
Neutral
SellBuy
Strong sellStrong buy
Strong sellSellNeutralBuyStrong buy
Neutral
SellBuy
Strong sellStrong buy
Strong sellSellNeutralBuyStrong buy
Displays a symbol's price movements over previous years to identify recurring trends.
Curated watchlists where VRA is featured.

Frequently Asked Questions
The current price of VRA is 2.20 USD — it has decreased by −0.45% in the past 24 hours. Watch Vera Bradley, Inc. stock price performance more closely on the chart.
Depending on the exchange, the stock ticker may vary. For instance, on NASDAQ exchange Vera Bradley, Inc. stocks are traded under the ticker VRA.
VRA stock has risen by 5.26% compared to the previous week, the month change is a −5.17% fall, over the last year Vera Bradley, Inc. has showed a −66.62% decrease.
VRA stock is 4.97% volatile and has beta coefficient of 1.35. Track Vera Bradley, Inc. stock price on the chart and check out the list of the most volatile stocks — is Vera Bradley, Inc. there?
Today Vera Bradley, Inc. has the market capitalization of 61.45 M, it has decreased by −15.64% over the last week.
Yes, you can track Vera Bradley, Inc. financials in yearly and quarterly reports right on TradingView.
Vera Bradley, Inc. is going to release the next earnings report on Sep 3, 2025. Keep track of upcoming events with our Earnings Calendar.
VRA earnings for the last quarter are −0.36 USD per share, whereas the estimation was −0.12 USD resulting in a −200.00% surprise. The estimated earnings for the next quarter are −0.15 USD per share. See more details about Vera Bradley, Inc. earnings.
Vera Bradley, Inc. revenue for the last quarter amounts to 51.65 M USD, despite the estimated figure of 53.48 M USD. In the next quarter, revenue is expected to reach 78.52 M USD.
VRA net income for the last quarter is −18.26 M USD, while the quarter before that showed −46.97 M USD of net income which accounts for 61.13% change. Track more Vera Bradley, Inc. financial stats to get the full picture.
No, VRA doesn't pay any dividends to its shareholders. But don't worry, we've prepared a list of high-dividend stocks for you.
As of Jul 27, 2025, the company has 1.73 K employees. See our rating of the largest employees — is Vera Bradley, Inc. on this list?
EBITDA measures a company's operating performance, its growth signifies an improvement in the efficiency of a company. Vera Bradley, Inc. EBITDA is −5.06 M USD, and current EBITDA margin is 0.23%. See more stats in Vera Bradley, Inc. financial statements.
Like other stocks, VRA shares are traded on stock exchanges, e.g. Nasdaq, Nyse, Euronext, and the easiest way to buy them is through an online stock broker. To do this, you need to open an account and follow a broker's procedures, then start trading. You can trade Vera Bradley, Inc. stock right from TradingView charts — choose your broker and connect to your account.
Investing in stocks requires a comprehensive research: you should carefully study all the available data, e.g. company's financials, related news, and its technical analysis. So Vera Bradley, Inc. technincal analysis shows the sell today, and its 1 week rating is sell. Since market conditions are prone to changes, it's worth looking a bit further into the future — according to the 1 month rating Vera Bradley, Inc. stock shows the sell signal. See more of Vera Bradley, Inc. technicals for a more comprehensive analysis.
If you're still not sure, try looking for inspiration in our curated watchlists.
If you're still not sure, try looking for inspiration in our curated watchlists.