VirTra, Inc. (VTSI) Expands Simulation Training ReachVirTra, Inc. (VTSI) is a leading provider of advanced simulation training systems for law enforcement, military, and security agencies. Known for its immersive VR-based technology, VirTra delivers realistic training scenarios to improve decision-making and situational awareness in high-pressure envi
Next report date
—
Report period
—
EPS estimate
—
Revenue estimate
—
0.13 USD
1.36 M USD
26.35 M USD
10.53 M
About VirTra, Inc.
Sector
Industry
CEO
John F. Givens
Website
Headquarters
Chandler
Founded
1993
FIGI
BBG000PJ0HS2
VirTra, Inc. is a provider of judgmental use of force training simulators, firearms training simulators and driving simulators for law enforcement, military, educational and commercial markets. Its simulators use software, hardware and content to create realistic training that does not require live ammunition or less-than-lethal munitions. It operates through the following segments: Simulators and Accessories, Extended Service-type Warranties, Customized Software and Custom Content, Installation and Training, Design and Prototyping, and Subscription Training Equipment Partnership. The company was founded by Robert D. Ferris in May 1993 and headquartered in Chandler, AZ.
Related stocks
Is VTSI close to a breakout?I bought this stock years ago but it never took off. I recently saw it on the news and I liked what I read. So I bought some stock again. The charts look pretty good. The one article mentioned a possible breakout coming. With it beating the expectations out of the water a couple times already, maybe

$VTSI is a gem in a world full of overvalued stocksIt's fundamentals are amazing, no need to spill any more words on that. It's astonishing how these opportunities are still present in a market.
But on a technical perspective we're at a crossroads here. We have an opportunity to sfp on the monthly while closing february bullish and above demand. If


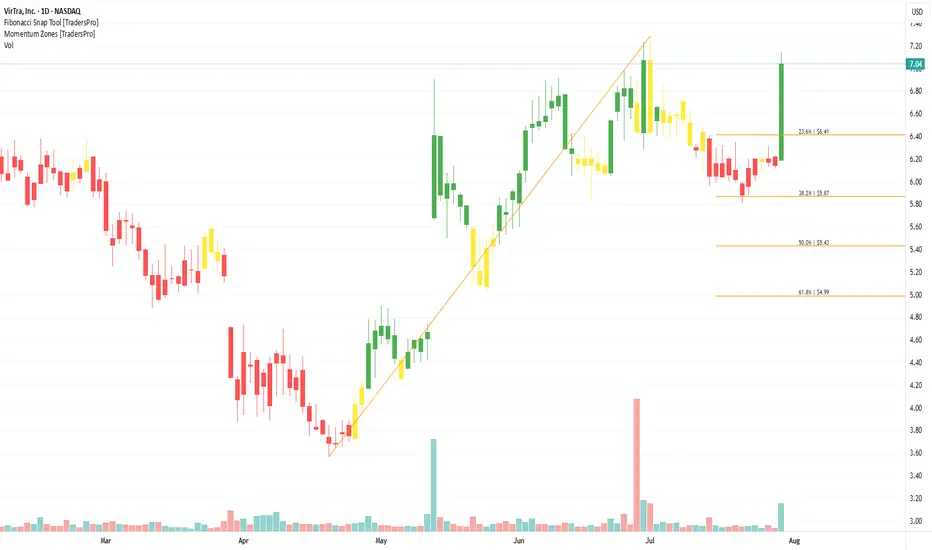
Bullish SwingVTSI had a period of consolidation in mid May to early June after testing the 50 SMA. MACD crossed recently and the price is currently well under the YTD POC line. Given the higher lows and the higher highs I think this bullish trend is looking strong.
Targets: 6.82, 7.81, 8.81

VTSI upside vs downside risk favorable after recent breakoutVTSI has moved up nicely during these past couple of days when the stock market corrected. The upside for VTSI is considerable since it is in a bullish Elliott 3rd wave. The downside is that gap at $5.07. With such a small downside risk, this is a good entry point.
I'm not sure if anyone's follo

VTSI breaking out after multi-week sideways consolidationI mostly publish ideas related to cryptos, but VTSI has repeated Elliott Wave patterns at multiple degrees. As you can see on this weekly chart, VTSI gapped up breaking out of several weeks long flag and has remained strong throughout the day. I'm always a fan of the third wave as it's usually the

VirTra Awarded $1.6 Million Contract for Use-of-Force SimulatorsVTSI: VirTra, Inc.
2020-04-09 16:30:10
VirTra Awarded $1.6 Million Contract for Use-of-Force Simulators and Police Driving Simulators

VirTra Awarded $5.0 Million Department of Homeland Security IDIQVTSI: VirTra, Inc.
2019-09-23 08:00:00
VirTra Awarded $5.0 Million Department of Homeland Security IDIQ Contract for Customs and Border Protection

$3 is Key Area SupportMake sure that $3 area holds and Volume stays consistent to keep driving these prices higher.

See all ideas
Summarizing what the indicators are suggesting.
Neutral
SellBuy
Strong sellStrong buy
Strong sellSellNeutralBuyStrong buy
Neutral
SellBuy
Strong sellStrong buy
Strong sellSellNeutralBuyStrong buy
Neutral
SellBuy
Strong sellStrong buy
Strong sellSellNeutralBuyStrong buy
An aggregate view of professional's ratings.
Neutral
SellBuy
Strong sellStrong buy
Strong sellSellNeutralBuyStrong buy
Neutral
SellBuy
Strong sellStrong buy
Strong sellSellNeutralBuyStrong buy
Neutral
SellBuy
Strong sellStrong buy
Strong sellSellNeutralBuyStrong buy
Displays a symbol's price movements over previous years to identify recurring trends.
Frequently Asked Questions
The current price of VTSI is 6.95 USD — it has decreased by −1.97% in the past 24 hours. Watch VirTra, Inc. stock price performance more closely on the chart.
Depending on the exchange, the stock ticker may vary. For instance, on NASDAQ exchange VirTra, Inc. stocks are traded under the ticker VTSI.
VTSI stock has risen by 12.46% compared to the previous week, the month change is a 6.27% rise, over the last year VirTra, Inc. has showed a −21.29% decrease.
We've gathered analysts' opinions on VirTra, Inc. future price: according to them, VTSI price has a max estimate of 9.50 USD and a min estimate of 7.00 USD. Watch VTSI chart and read a more detailed VirTra, Inc. stock forecast: see what analysts think of VirTra, Inc. and suggest that you do with its stocks.
VTSI reached its all-time high on May 20, 1998 with the price of 65.00 USD, and its all-time low was 0.04 USD and was reached on Jul 14, 2008. View more price dynamics on VTSI chart.
See other stocks reaching their highest and lowest prices.
See other stocks reaching their highest and lowest prices.
VTSI stock is 5.50% volatile and has beta coefficient of 1.82. Track VirTra, Inc. stock price on the chart and check out the list of the most volatile stocks — is VirTra, Inc. there?
Today VirTra, Inc. has the market capitalization of 79.84 M, it has decreased by −2.53% over the last week.
Yes, you can track VirTra, Inc. financials in yearly and quarterly reports right on TradingView.
VirTra, Inc. is going to release the next earnings report on Aug 11, 2025. Keep track of upcoming events with our Earnings Calendar.
VTSI earnings for the last quarter are 0.11 USD per share, whereas the estimation was −0.07 USD resulting in a 257.14% surprise. The estimated earnings for the next quarter are 0.02 USD per share. See more details about VirTra, Inc. earnings.
VirTra, Inc. revenue for the last quarter amounts to 7.16 M USD, despite the estimated figure of 5.46 M USD. In the next quarter, revenue is expected to reach 6.37 M USD.
VTSI net income for the last quarter is 1.26 M USD, while the quarter before that showed −1.64 M USD of net income which accounts for 177.25% change. Track more VirTra, Inc. financial stats to get the full picture.
No, VTSI doesn't pay any dividends to its shareholders. But don't worry, we've prepared a list of high-dividend stocks for you.
As of Aug 2, 2025, the company has 111 employees. See our rating of the largest employees — is VirTra, Inc. on this list?
EBITDA measures a company's operating performance, its growth signifies an improvement in the efficiency of a company. VirTra, Inc. EBITDA is 3.38 M USD, and current EBITDA margin is 12.95%. See more stats in VirTra, Inc. financial statements.
Like other stocks, VTSI shares are traded on stock exchanges, e.g. Nasdaq, Nyse, Euronext, and the easiest way to buy them is through an online stock broker. To do this, you need to open an account and follow a broker's procedures, then start trading. You can trade VirTra, Inc. stock right from TradingView charts — choose your broker and connect to your account.
Investing in stocks requires a comprehensive research: you should carefully study all the available data, e.g. company's financials, related news, and its technical analysis. So VirTra, Inc. technincal analysis shows the buy rating today, and its 1 week rating is strong buy. Since market conditions are prone to changes, it's worth looking a bit further into the future — according to the 1 month rating VirTra, Inc. stock shows the buy signal. See more of VirTra, Inc. technicals for a more comprehensive analysis.
If you're still not sure, try looking for inspiration in our curated watchlists.
If you're still not sure, try looking for inspiration in our curated watchlists.