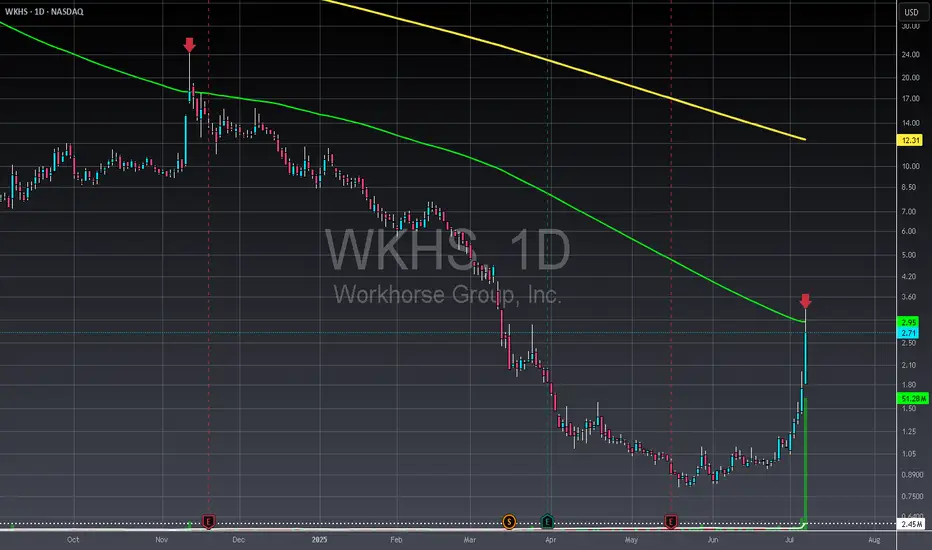
WKHS - Daily - Likely Pump and DumpThis company, founded in 2007, maintains a modest market cap of $26 million, indicating a lack of significant investment. They have consistently experienced negative net income between 2022 and 2024, and despite an improved free cash flow in 2024 compared to 2020-2023, their cash and equivalents are nearly depleted, suggesting potential financial difficulties in the coming years. From a technical analysis perspective, the stock has reached its 100-day moving average target, following a similar pump behavior from around November 12, 2024, making it an unfavorable time for long positions, and current investors should exit. Furthermore, the stock shows no signs of accumulation, though a volume uptick around May 28, 2025, could suggest insider trading.
Not financial advice, always do your due diligence
Leave a like👍 and/or comment💬.
We appreciate and value everyone's feedback!
- RoninAITrader
WKHS trade ideas
The greatest short ever?! Is Celsius next...The greatest short ever?!
NASDAQ:WKHS -99.92% 🔪🩸
Is this what's in store for NASDAQ:CELH ?!
Brought to you by the Tweezer Pattern
What say you?
Not financial advice

WKHS The horse that works extra hard does all the workInteresting trend alignment on WKHS that has a possible drop really low which could spring the price, there is also potential for a confirmation due to a short increase in price which could theoretically do the same. The better climb for the price would be to DROP first to .4999 and then rocket upwards, however, there is a chance, that .8 takes the price to 1.2 which then sees the big drop to .4999, which leaves with the final chance of the $7 jump going .4999. It seems this .4999 is the move that springs the price upwards of $30, otherwise I wouldn't be as hopeful. It should happen fast, and retracements should happen fast.
Good luck!
Line on chart is more of an estimate or guideline, instead follow the price targets and trends.
Here's an analysis of the chart for Workhorse Group, Inc. (WKHS):
Timeframe:
Daily Chart: This chart shows daily price movements from late 2022 to the present, around November 2024.
Price Movement:
Initial Decline: From late 2022 into early 2023, there was a significant decline in the stock price, dropping from above $30 to below $2.
Consolidation: Post-decline, the stock entered a consolidation phase, trading sideways with minor fluctuations around $2 to $4 from mid-2023 to early 2024.
Recent Surge: There's a notable sharp increase in the stock price towards the end of 2024, rising significantly from around $1.20 to over $30.
Technical Indicators:
Moving Averages:
200-day Moving Average: The stock price has been below this moving average for most of the period, indicating a long-term bearish trend. However, the recent surge has pushed the price above this average, suggesting a potential shift to bullish sentiment.
Support/Resistance:
Support: Around $1.20, where the price bounced back before the surge.
Resistance: Previous highs around $30 could act as psychological resistance, but the recent break above this level suggests strong bullish momentum.
Volume:
Volume Spike: There's a noticeable increase in volume during the recent price surge, indicating strong buying interest.
Chart Patterns:
Inverse Head and Shoulders: Towards the end of the chart, there's a formation that resembles an inverse head and shoulders pattern, which is typically a bullish reversal pattern.
Neckline: The breakout above the neckline around $1.20 confirms this pattern, projecting a potential rise to around $30, which the stock has already achieved.
Fibonacci Retracement:
Not explicitly shown, but if drawn from the peak to the trough before the surge:
61.8% Retracement: Around $18.90, which could be a potential target or resistance level.
Analysis:
Trend Reversal: The recent surge indicates a strong reversal of the downtrend that dominated from late 2022 to early 2024. This could be due to positive news, earnings, or market sentiment.
Momentum: The stock has significant upward momentum, but after such a rapid increase, it might face profit-taking or consolidation at these levels.
Risks: Given the rapid rise, there's a risk of a pullback or correction. If the price fails to hold above the previous resistance at $30, it could see a sharp decline.
Conclusion:
Bullish Outlook: The chart suggests strong bullish momentum with potential for further gains if the current sentiment holds. However, caution is advised due to the possibility of a pullback after such a steep rise.
Entry Points: For those looking to enter, waiting for a pullback to test support around $20-$25 or using options for less risky exposure might be wise.
Stop Loss: For traders, setting a stop loss below the recent breakout level around $1.20 or the 50% retracement level could manage risk.
Remember, while technical analysis provides insights, fundamental analysis and understanding the company's news, earnings, and market conditions are crucial for making informed trading decisions.

WKHS Longdaily, Wedge breakout + trendline break + retest
Higher high + higher low
Long 1.04
no Stop
Target 3.0, 7.0
Risk management is much more important than a good entry point.
I am not a PRO trader.
In my trading plan, the Max Risk of each short term trade should be less than 1% of an account.

WKHS will it rally 50% or fall below its ATL WKHS has been sideways or down since the bullrun in late February. Another EV small cap
is nearing bankruptcy unless it finds a suitor ( FSR trying to attract Nissan) WKHS has a niche
with its delivery trucks ( like for Amazon Prime and USPS). Is the concept to production
hangups and slow downs going to cause its demise? Trader confidence is lacking or are
traders simply waiting for the best possible price? Price is now about to match the all-imte lows
of mid February. Will there be support or will it fall.? Dould WKHS dead cat bounce to rise
to recent high pivots? This may be interesting and potentially profitable.

Can we work it out?Peek at Workhorse Group Inc. (WKHS) like you're checking out a potential date.
Identify Trend: Figure out if this stock is going up or down like a rollercoaster—without the screaming.
Draw Fibonacci Retracement: Find the recent high and low like you're searching for your lost keys.
Plot Fibonacci Extension: Draw lines at 23.6%, 38.2%, 50%, 61.8%, and 100% like you're planning your future kitchen renovation.
Set Targets: Use those Fibonacci lines as price targets like they're that perfect slice of pizza.
Entry Point: Buy when it’s near support or breaking resistance like you’re diving for the last slice of cake.
Risk Management: Set stop-loss orders below key support levels like putting on a helmet before a wild ride.
Monitor: Keep an eye on the stock like it’s your toddler in a can

Last minute bangerThis companies market cap was squeezed dry. Watch tomorrows earnings for a quick 100% gainer

WKHS a risky penny EV StockWorkhorse could start working again as the 50 minute chart is showing a suggestion of a reversal
after a long trend down. Price has passed over the longest moving average which is a SMA20.
The EMA cloud ( 100, 200, 300) is starting to turn up and price has crossed over it. All in all,
there are some golden crosses here. Blue buying volume spikes are seen on the relative
volume indicator and they are about six times the running mean. In a bit of divergence the
price volume trend has oscillated up. Overall, this is a penny stock with a price under $ 1.00
It appears to be starting a trend up. I will zoom into a lower time frame and find a optimal
entry. I amy get call options as well. The risk in the trade should be limited by a stop loss
wide enough to allow for a true range or even twice that. My target is about 1.15 the price level
at the time of the last good earnings report. This is about 300% upside. It will probably never
get there but hay you never know. Stranger things have happened.

WKHS Workhorse Group Options Ahead of EarningsAnalyzing the options chain and the chart patterns of WKHS Workhorse Group prior to the earnings report this week,
I would consider purchasing the 0.50usd strike price Puts with
an expiration date of 2025-1-17,
for a premium of approximately $0.30.
If these options prove to be profitable prior to the earnings release, I would sell at least half of them.
Potential reversal stock split announcement soon, in my opinion!


WKHS is setting up for a short ( again) OR could it reverse ?WKHS is a mong the weakest of the EV stocks. On the 15 minute chart it has been trending
down in a descending channel. There has been substantial volume on the bearish only volume
profile albeit at higher prices. A small spike of selling volume while price is near to the upper
( resistance) trend line of the channel tells me that WKHS may move lower. Most of the time,
it is difficult to short a penny stock below $1.00 depending on the broker. The selling volume
tells me there are short trades underway. My idea however is to look for a reversal so long
and watch for a short squeeze to add into the rising price with more position. Probably will
not happen but it goes onto the watch list.


Megaphone pattern ABCDE for WKHS?Can't stop seeing this megaphone pattern, at the lows mid 2024 may be worth throwing some money at it and see if it at all plays out. RIG had a similar megpahone pattern and it played out pretty nicely. LEt's see in a a few months?

WKHS: Falling Wedge With Bullish Divergence Into The 2018 ZoneWKHS has formed a Falling Wedge with Bullish Divergence on the Daily as it has come down into the December 2018 Low. It has also Bullishly Engulfed the previous Daily Candles and has exhausted the Options Chain. At this point in time I'd expect WKHS to make its way back above 50 cents and perhaps run up to around $1 or perhaps a bit higher which would be best played by buying the call options at the 50 cent strike which currently trade at below 5 cents.

$WKHS - Bottomed Chart - 93M Marketcap - 80% CTB, 0 short sharesIt's going to be an interesting start of the year. WKHS has resolved their HVIP issues according to their latest earnings. 93M marketcap for something that will do 10-15M in revenue in 2023. With the HVIP issues resolved, this should pick up in 2024. 80% cost to borrow rate currently and 0 short shares available. An excellent squeeze candidate. I have a position here. Make your own financial decisions.

Workhorse Group, IncOn the above bi-weekly chart price action has corrected 97% since the sell signal printed in late 2020. A number of reasons now exist to have a long position, including:
1) You know why..
2) Price action and RSI resistance breakouts.
3) Multiple oscillators print positive divergence with price action.
4) No stock splits.
5) Some other things, will say elsewhere.
Is it possible price action falls further? Sure.
Is it probable? No.
Ww
Type: investment
Risk: <=6% of portfolio
Timeframe:1-2 months, no rush.
Return: no idea
Stop loss: will say elsewhere

Yeah its not producing much, buy!This company is working with UPS and building drones. Along with building there own delivery truck.
Lesson to learn:
Stock in bearish environment = will fall on good earnings.
Stock in bullish environment = will pop on bad earnings.
Look at the horizontal line, its a take profit zone...
IWM = bullish... this stock will moon tomato tamato

WKHS outlook for 2 year?Hi all.
The candle fractal is from 2017 May till the bull run.
Looks so similar, and the timing is as well, hope we will follow this fractal.
Thanks

WKHS.NYSE Workhorse Cup & HandleWorkhorse Group chart has printed a Cup & Handle pattern which is a Bullish sign.
Smash that Rocket Boost Button if you like my Chart Study.
Many Thanks
Graham.

Workhorse - Cup and HandleWKHS at the neckline of small cup and handle ready to potentially break up on H4. Higher time frame confluence of a macro double bottom (2018/19 - red line) before it went on it's most recent crazy run up and back down to these pre covid levels.
Expecting a similar outcome so targets (Purple lines)
T1 - 60
T2 - 70
Multiple drives of RSI divergence on the H4 and even D1 combine this with rising volatility and could be new trend forming on lower time frames.
Macro Reversal Plan - hit above target; then reverse to the lows of 40 and paint a W pattern at the lows on a higher time frame (or continue downside).

Workhorse Group Potential IH&SWorkhorse Group is printing a Potential Inverse Head & Shoulder Pattern.
>$1.2 is a critical key level to break for a possible 20% gain.
Lets give this down trodden Ticker some hope for recovery.
Regards
Graham Hitchcox

WKHS is Ready to Pump from this LevelLooks like the price is retesting the channel support from 2014 before moving up. There is great confluence from 2019 when the price had its spring retest. SNAB RSI is showing bullish divergence on the daily chart and EMA is trading above the RSI.
This is one people have loved to short. There are probably a lot of sell orders that get filled quickly and then are going to be covered in short order. Great melt-up potential

WKHS: Bullish Signals Galore as Volume Surges and Key IndicatorsHello Traders! Today, let's dive into Workhorse Group Inc. (WKHS). With a recent spike in volume and several bullish indicators aligning, WKHS seems to be attracting attention. Let's take a closer look at the technical analysis and key signals driving this potential trade.
📈 Price Action and Volume:
WKHS is currently trading at $1.05, displaying an intriguing price level for both short-term traders and long-term investors. The recent surge in volume suggests increased interest in the stock, adding to the excitement surrounding WKHS.
📈 Relative Strength Index (RSI):
The RSI is a powerful momentum indicator used to gauge overbought or oversold conditions. In the case of WKHS, the RSI is on the rise, indicating growing bullish strength. This upward trend in RSI suggests that buyers are stepping in, potentially driving the stock's price higher in the near term.
📈 Positive Directional Indicator (+DI) Crossed Over Negative Directional Indicator (-DI):
The +DI crossing over the -DI is a classic bullish signal derived from the Directional Movement Index (DMI). This crossover indicates a shift in momentum from bearish to bullish, potentially pointing to an upward trend in WKHS. Traders often consider this signal as a buying opportunity.
📈 Moving Average Convergence Divergence (MACD) Histogram:
The MACD histogram is an essential tool for identifying changes in a stock's trend. Currently, WKHS is showing a heavy bullish MACD histogram, indicating a strong buying presence in the market. This bullish momentum, combined with the increasing volume, could contribute to further price appreciation.
📈 Average Directional Index (ADX):
The ADX measures the strength of a stock's trend. As the ADX starts to rise, it suggests the possibility of a new trend forming. With WKHS, the ADX is starting to rise alongside the bullish signals mentioned earlier, reinforcing the potential for a sustained upward movement.
📊 Conclusion:
In summary, Workhorse Group Inc. (WKHS) presents an exciting trading opportunity. The recent spike in volume, coupled with the rising RSI and the +DI crossing over the -DI, indicates a shift towards a bullish momentum. Furthermore, the heavy bullish MACD histogram and the ADX beginning to rise with the trend all add to the positive outlook for WKHS.
As always, it is essential to conduct thorough research and perform your own analysis before making any trading decisions. Keep a close eye on WKHS as it develops and consider incorporating these signals into your trading strategy. Best of luck, and may the markets favor your trades! 📈💪
News:
Workhorse Group Engages Burr Truck and Trailer Sales as its First Distribution and Service Partner in New York - 7/12/23
finance.yahoo.com
EV Roundup: RIDE Files for Bankruptcy, WKHS Hits Milestones & More - 7/3/23
finance.yahoo.com
Workhorse (WKHS) Commences Production of W750 Electric Van - 6/28/23
finance.yahoo.com
