A dark horseReally think this one could blow off again. EV is hot and stocks like workhorse is perfect to pick up before it's 1 usd.
WKHS trade ideas

WKHS reverses in sync with NKLAWKHS is in similar circumstances as NKLA in the potential for a delisting due to low share
price. NKLA has been cleared and is a bit above $1.00 ( see my bullish bias idea)
Here WKHS is below $1.00 but is apparently reversing. On the 30 minute chart, price is rising
and is above various VWAPs anchored to the left at various points. The last trading day
saw a price rise of over 8% Relative volatility has changed from red to green and is above the
running average. The zero-lag MACD shows parallel lines rising above the histogram. The three
in one indicator shows that money flow, RSI movement and momentum are all bullish.
I see the setup as sufficient for potential profit given the risk. I will take a long trade here
selecting an exact entry on a lower time frame chart. The stop loss will be just below the VWAP
lines at $0.8335. ( A rising tide lifts all boats? - FSR FCEL PLUG AND NKLA are rising . so
are TSLA and Ford- I love the buoyancy !)

Workhorse is at a Support Between the 0.786 and 0.886 RetracesWorkhorse looks like it could be setting up for a Spring off of an Ice Line that aligns with the 0.786–0.886 Fibonacci Retraces. It also seems to be somewhat Bullishly Diverging on the MACD though not perfectly. If this turns out to be the bottom, then it could go for an inverted AB=CD move all the way up to the 1.272 Fibonacci Extension up at $125.92.

Workhorse threatening trend reversalWorkhorse is at the neckline of the trend-line today, it needs a surge 10% above the trend-line for reversal confirmed.

Harmonic Bat bullish pattern We can see the price action of this chart for WKHS
After the correction we can see the Harmonic Bat pattern, the price stock going for long trend in the next days.
The first target at 0.38 Fibonacci in this area between 0.38 & 0.5 Fibonacci I think it's aggregation zoon for the next momentum to the next target.

Story of a Bubble created by ARK invest.You can distinguish a bubble, participate in it take your profit out, and leave the tears to others!
Don't you believe it?
Check my previous posts on Workhorse NASDAQ:WKHS :
Oct 23, 2020:
Is the correction finished in workhorse?
Jan 6
40 -42 would be the new target!
Feb 11
What are my reasons to sell workhorse:
1-multiple attempts but could not close above the channel.
2- lower high - Lower Low pattern in daily candle
3-workhorse experienced a 117% bullish rally in 2021, and usually, after a sharp rally, we will expect a correction. Workhorse experienced a 30-50% correction in the last 3 corrections it had!
4- I had a price target of 40-42 for workhorse when it was 22-23
Feb 23
Feb 24
soon will be below 5..!
This art is named Bubbelogy..!

WKHS: Bullish 5-0 on the Monthly with MACD Bullish CrossoverWKHS is at the PCZ of a Bullish Gartley on the Daily timeframe.
It's also at the PCZ of a much greater Potential Bullish 5-0 and Reciprocal AB=CD all while Bullishly Crossing Over on the MACD.
If things go as one would expect a 5-0 to go we will see WKHS try to target the $42 Area in an effort to atleast make a 100% Retrace.

WKHS early breakout from Descending Triangle LONGNASDAQ:WKHS
Here on the 15-minute chart, WKHS is seen in an early breakout
from a descending triangle, Trendlines and relevant overhead resistances are shown.
A long position is shown with a 40% upside and an inital stop loss of 8 % for a
reward to risk of 5. The stop loss would be moved to breakeven upon 10% price
rise. While this is a long stock trade setup, a call option trade could be
made from the chart setup here.

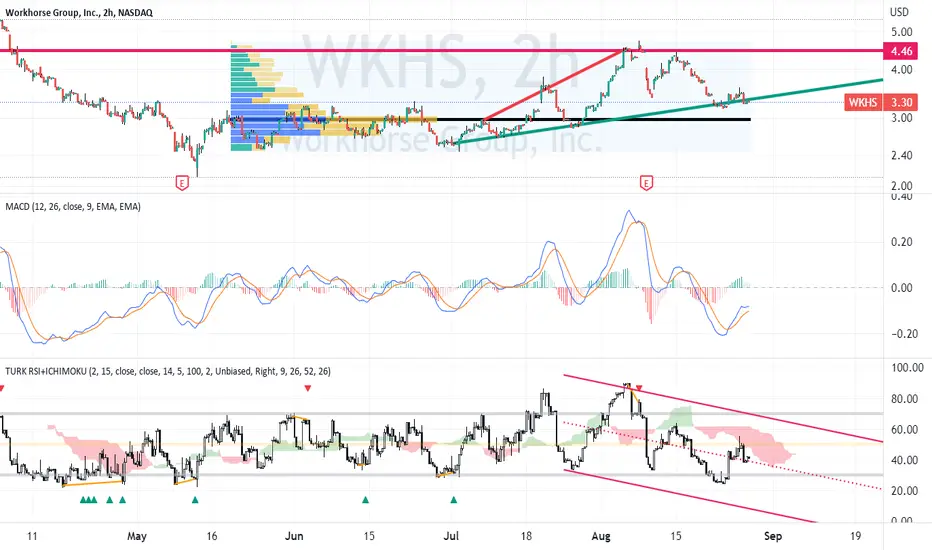
WKHS LONGWKHS on the 2H chart is showing an ascending megaphone pattern.
Price is currently sitting on the ascending support line and above the POC of the volume profile.
The MACD lines are underneath the histogram while the RSI is in the mid-range.
I see this as a swing long setup targetting first the top of the volume profile
and then the upper resistance trendline The upside is 30 and 50 % respectively
making it a low risk when placing a stop loss at 3.22 the swing low from the beginning
of the week. A xll option trade with a strike of $3.50 for September 16th is also considered.
$WKHS: interesting junctureI will list a series of facts, which make me think we can gamble a small amount of money on a long shot trade entry in $WKHS:
The new climate spending bill includes items that could benefit EV names, and there could be renewed interest in names that could end up landing the deal with the United States Postal Service to provide them with vans. www.bloomberg.com
cathiesark.com Cathie Woods sold. Bullish.
Long term mode retested, after the prior long term bullish trend signal peaked at the target as per my forecast published here ages ago, it has come all the way down and it's basing, could be a bottom in the making, as we had 13 months elapse since the expiration of the last monthly trend, which was at the end of June, weekly trend turned up since and monthly put on a strong candle, with a range expansion move signaling strength.
I'm long, small 1% position as a 'long shot' trade. Potential reward to risk is interesting, but worst I can lose is 1% if it goes to $0. (that's what I call a 'long shot')
Let's see how it goes, my other positions here are $TSLA, $F and a small bet in $RIVN as well.
Cheers,
Ivan Labrie.

More work to do for this horse Workhorse Group
Short Term
We look to Sell at 3.19 (stop at 3.42)
A shooting star has been posted as prices reject the higher levels. Previous resistance located at 3.14. The medium term bias remains bearish. Upward pressure has continued and we are assessed as being in the corrective leg before the next selloff.
Our profit targets will be 2.67 and 2.45
Resistance: 3.20 / 5.30 / 7.50
Support: 2.65 / 2.20 / 2.00
Disclaimer – Saxo Bank Group. Please be reminded – you alone are responsible for your trading – both gains and losses. There is a very high degree of risk involved in trading. The technical analysis, like any and all indicators, strategies, columns, articles and other features accessible on/though this site (including those from Signal Centre) are for informational purposes only and should not be construed as investment advice by you. Such technical analysis are believed to be obtained from sources believed to be reliable, but not warrant their respective completeness or accuracy, or warrant any results from the use of the information. Your use of the technical analysis, as would also your use of any and all mentioned indicators, strategies, columns, articles and all other features, is entirely at your own risk and it is your sole responsibility to evaluate the accuracy, completeness and usefulness (including suitability) of the information. You should assess the risk of any trade with your financial adviser and make your own independent decision(s) regarding any tradable products which may be the subject matter of the technical analysis or any of the said indicators, strategies, columns, articles and all other features.
Please also be reminded that if despite the above, any of the said technical analysis (or any of the said indicators, strategies, columns, articles and other features accessible on/through this site) is found to be advisory or a recommendation; and not merely informational in nature, the same is in any event provided with the intention of being for general circulation and availability only. As such it is not intended to and does not form part of any offer or recommendation directed at you specifically, or have any regard to the investment objectives, financial situation or needs of yourself or any other specific person. Before committing to a trade or investment therefore, please seek advice from a financial or other professional adviser regarding the suitability of the product for you and (where available) read the relevant product offer/description documents, including the risk disclosures. If you do not wish to seek such financial advice, please still exercise your mind and consider carefully whether the product is suitable for you because you alone remain responsible for your trading – both gains and losses.

Workhorse......hope to be wrongas per daily waves, it looks like has to complete the fifth leg down by mesuared move.

Workhorse #WKHS support & resistanceIn no way, shape or form am I an expert in charts but I like to look and learn from them.
Based on trading since June-July 2020, following seems to be key resistance and support for our horse.
$4.7 to $5.48 (currently we are in that trading zone)
$6 to $7.25 is where we traded from late Sept till Nov 2021
From early April till May 2021 there is a narrower area of resistance/support $11.66 to $13.36
Our major areas of support/resistance where you can see the heaviest volume is from $13.90 to $17.69 (this is where myself started buying WKHS last year).
We have wandered in this price range at least 3 times over the last 2 years; July till Sept 2020, Feb till March, followed by June till July 2021.
Last area is from $22.4 till $30.44.
Gap plays to watch
$7.25 to $11.66
$17.6 to $22.4
$30.44 to ATH of $42.89
#WKHS
#WKHSto100

Long position on WKHSI should have been posted this 3 days ago. I see potential long position above 4.50 with a couple of targets

WKHS - bottom is inAfter hitting a high of 42.96 on 4 Feb 2021 (more than a year ago!), WKHS was on a long term decline until recently when it looked like WKHS has finally bottomed out, forming a mini inverted Head & Shoulders pattern and has since broke up decisively above this neckline yesterday.
Any near term pullback is likely to be supported at the neckline @ 3.90. And when this happens, it would provide a 2nd opportunity to long at low risk.
Initial target is at 5.20 (inverted H&S target). I'll put initial stop loss several ticks below the neckline @ 3.90. We do not know how much it can recover (am certainly not expecting anywhere it's ATH of 42.96 lol). Trail stops up along the way and let's see how far it can go.
Disclaimer: TA is about improving our odds of a successful trade (not a guarantee). This is just my own analysis and opinion for discussion and is NOT a trade advice. Please your own due diligence and trade according to your own risk tolerance and don't forget that money management is important! Cheers.

WKHSWorkhorse Group Inc., a technology company, engages in design, manufacture, and sale of zero-emission commercial vehicles in the United States. The company offers electric and range-extended medium-duty delivery trucks under the Workhorse brand; and HorseFly Unmanned Aerial System, a custom-designed purpose-built all-electric drone system. It also provides Metron, an air delivery application that tracks the performance of various the vehicles deployed.
The company was formerly known as AMP Holding Inc. and changed its name to Workhorse Group Inc. in April 2015. Workhorse Group Inc. was founded in 2007 and is headquartered in Loveland, Ohio.
REWARDS
Revenue is forecast to grow 63.95% per year
RISK ANALYSIS
Makes less than USD$1m in revenue ($-852K)
Currently unprofitable and not forecast to become profitable over the next 3 years
Volatile share price over the past 3 months
Shareholders have been diluted in the past year
Mar 16
Insider recently bought US$169k worth of stock
On the 14th of March, Stan March bought around 50k shares on-market at roughly US$3.37 per share. This was the largest purchase by an insider in the last 3 months. This was the only on-market transaction from insiders over the last 12 months.
Mar 08
Consensus revenue estimates increase by 48%
The consensus outlook for revenues in 2022 has improved.
2022 revenue forecast increased from US$16.0m to US$23.7m.
Forecast losses expected to reduce from -US$0.63 to -US$0.49 per share.
Auto industry in the US expected to see average net income growth of 5.7% next year.
Consensus price target down from US$7.58 to US$6.75.
Share price rose 16% to US$3.63 over the past week.

WKHS Long position RR=1:41Dear Friends
Monthly Demand Zone is Strong Enough and In Daily TF Last Supply Zone Destroyed
We are Waiting Price Comeback To Daily Zone
1:41 Risk To Reward For Following Month isn't Great??

Workhorse breaking out of downtrendWorkhorse is breaking out of a long downtrend, which lasted more than a year.
Can this "horse" run to 7$?

end of (a) wave of the 2nd wave?cypher harmonic pattern:
X=$61.5
AB=0.61 XA
BC=1.41 AB
0.78 XA=$24.47
1.27 BC=$29.7
0.88 XA=$37.64
1.6 BC=$96.67
1.13 XA=$107.65
2 BC=$355
the 2nd wave has been considered cypher too:
ab=0.61 xa
bc=1.41 ab

WKHS6.5 to 8 USD
is it the buy zone?
-85% from top
200 MA day support
almost bottom of the green channel
Share your opinion in the commend below :D


WKHS Fully retraced 90% of the parabola. Seems like a decent spot for 2024 option. Good luck out there, cheers!

