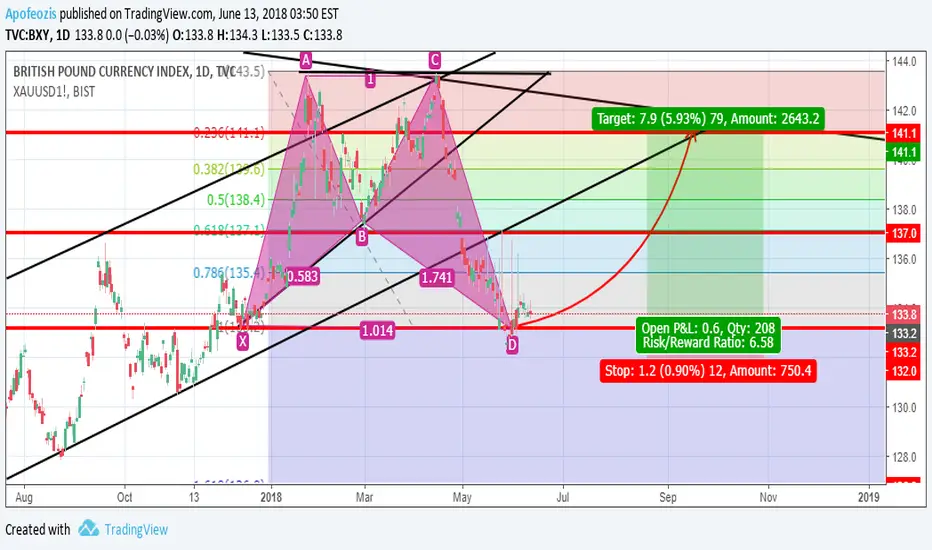
D1 BXY (British pound currency index) High probability to start Buying GBPxxx pairs and Selling xxxGBP.
XDB trade ideas

GBP's historical "Complex head and shoulders top" (bear market)Looking at the historical charts of British pound (since 1953) I noticed that it formed quite a fine complex head and shoulders with double top and multiple shoulders. This pattern is described in detail by Thomas Bulkowski in the Encyclopedia of Chart Patterns. The performance of this pattern in bear market is 8 out of 21. The breakout from neckline occurred in the early 2017. In 60 % of cases of "complex head and shoulders tops" pullbacks occur in 60 % of cases (in bear market) what we have just witnessed. Price pulled back to neckline. Percentage meeting price target is 45 % and tall patterns perform better than short ones (we do have a tall head of 17 months span). If the rally meets the price target, it will be the ultimate historical bottom for GBP, lower than the decline of 1985! This will cause economic turmoils in the UK (situation is already tense because of Brexit turmoil) and possible secession of pro-EU Scotland. This decline is not surprising as GBP has been in decline since 1953 - it dropped from 2.81 to 1.35 against the USD in the course of 68 years). I believe this is a great chance for long term sells of GBPJPY (JPY as standalone index already shines bullish and is going to rise through summer and fall), GBPCAD (as CAD is to strengthen through the summer, from early June I would say), GBPCHF (frank is also strong and is starting a bullish rally this month, bullish signs already in play), GBPNZD (from July when Kiwi will turn bullish) and GBPUSD too. We will see massive bearish rallies on those pairs this year. EURGBP isnt a good choice as both currencies are in decline (forming a consolidating market), though GBP is gonna move down faster.


GBP LongGBP long based on fundamental, supported technical as expected last wave in a 1 year long trend


British pound falling...British Pound has been in a free fall since 2008. A year a ago (January 2017) it started doing a retrace and pulled back to the fib level. It didnt manage to establish itself above the fib level forming a double top. Now it started falling again. Expect a significant drop (the size of double top formation - from neck to top) when it breaks through a yearly trendline. That should happen in a few days. Today (28.04) it dropped massively forming a gap (if you look at normal candles, I used Heiken Ashi in this chart). A falling gap (window) is a sign of further bearish trend. Tomorrow it might slightly pull back into ATR channel (today it fell out of it). And in a few days we should see a further ride down. Prepare for for more GBP pairs sales esp. against traditionally strong currencies as safe haven JPY or gold driven AUD.

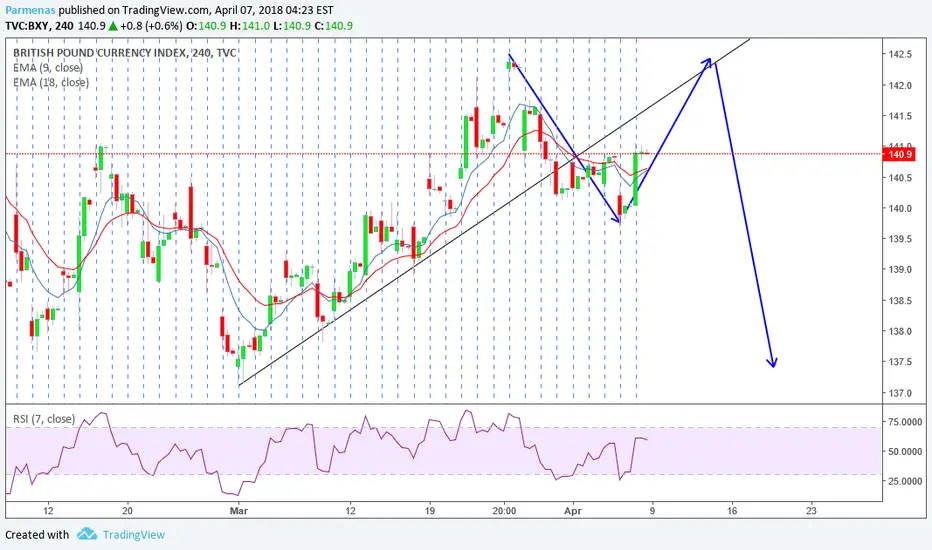
BXY Little long for 2 or 3 days and short ideauptrend trendline has been violated. pullback is coming, then big short
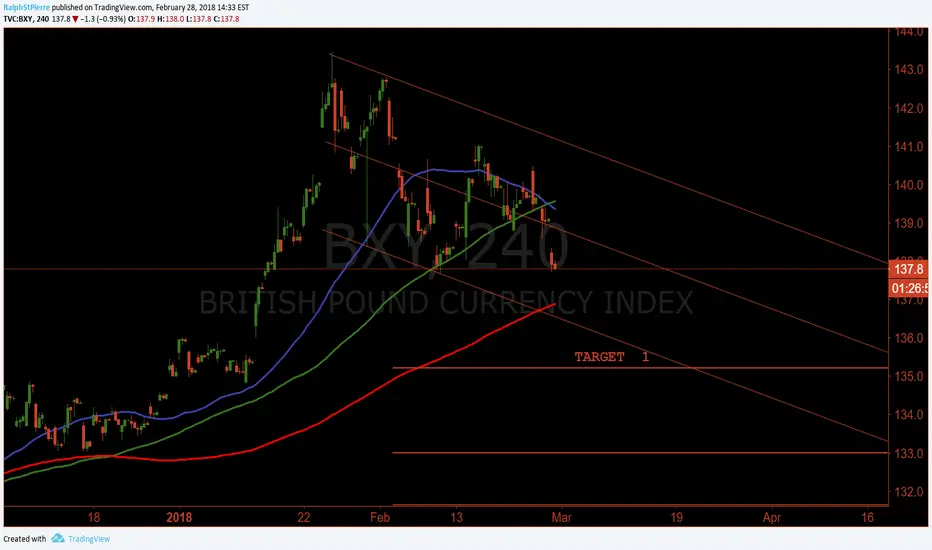
BRITISH POUND INDEX.Wait for the breakout or breakdown from the pennant for an indication as to whether or not we are going to test the top or bottom of the channel.

BXY- GBP INDEX- up in 15 min I have made analysis on GBPUSD before... and DXY analysis too...and it looks like BXY is going up DXY going down , so GBPUSD going up.
Please refer to below link i have provided for more information...


BXY - GBP extremely Bullish - High risk reward tradeBXY - GBP extremely Bullish - High risk reward trade


If the Bank of England rise interes rates we will see a nice BatThis trading idea is only valid if Bank of England rise interest rates. In the mean time will be moving inside that yellow channel. Be patient and wait for thursday.

BXY Weekly updateConfirmation of a completed wave 4 has yet to be confirmed. AO cross below 0 confirms the completion of the 4 wave weekly. Channel traders can use a channel brake for confirmation. Wave 1 equality and fib 1.618 extension gives us a projected price of the 114-113.6 area. Our trade zone will be the blue box to protect us from a truncated fifth wave. At that point protect your short positions with good trade management that will also allow you to exploit the maximum of the fifth wave projection. I will be looking for short opportunities in GU to trade pound weakness. Combined with projected dollar strength GU can be giving us some high probability opportunities.


CXY and BXYCXY high probability on its way to fill the gap
BXY No trade set-up yet...but its trying. and has a gap fill also
