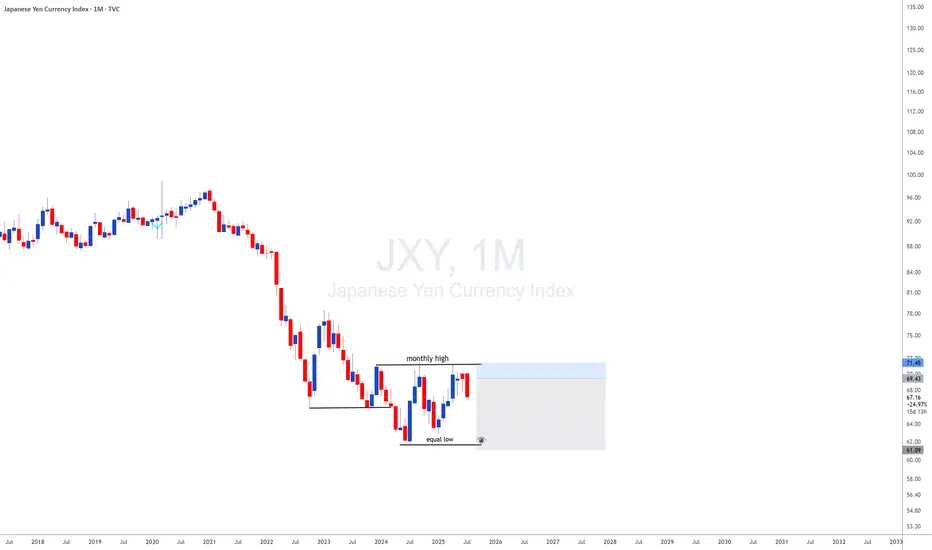
JXY with JXY looking monthly downside and DXY looing upside i will be looking for 35 years breakout of usdjpy meanning uj is a long therm upside
How to View the Assets in Japan
It should be noted that many of the assets the government owns are not marketable, or, if so, their
price can sharply drop
Related indices
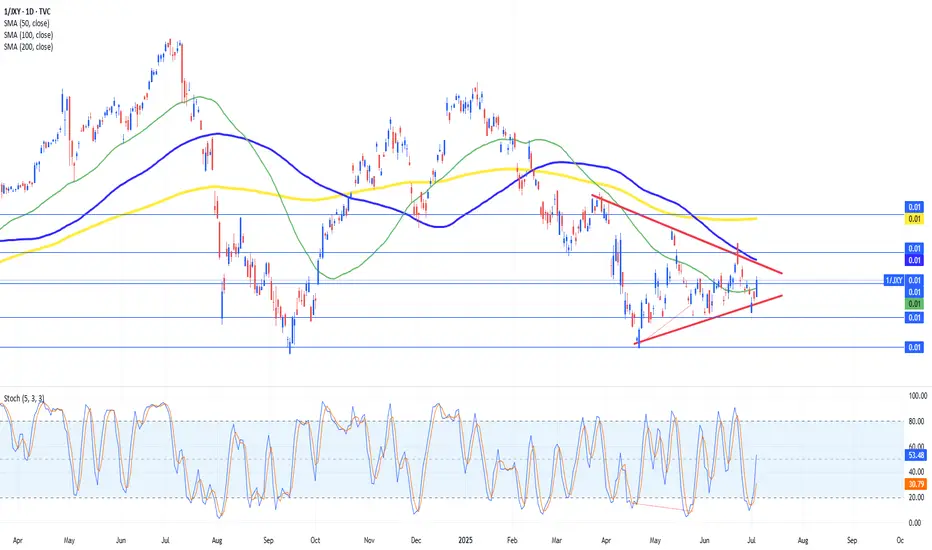
USDJPY Converges in Triangle Ahead of Potential BreakoutUSDJPY on the daily chart is coiling within a textbook contracting triangle, with support ascending near 143.00 and resistance compressing downward toward 147.00. This symmetrical structure suggests traders are awaiting a decisive catalyst, as volatility has steadily declined alongside rangebound pr
JXY Stock Chart Fibonacci Analysis 061125Trading Idea
1) Find a FIBO slingshot
2) Check FIBO 61.80% level
3) Entry Point > 69.2/61.80%
Chart time frame:D
A) 15 min(1W-3M)
B) 1 hr(3M-6M)
C) 4 hr(6M-1year)
D) 1 day(1-3years)
Stock progress:A
A) Keep rising over 61.80% resistance
B) 61.80% resistance
C) 61.80% support
D) Hit the bottom
E

Japanese Yen index Chart Fibonacci Analysis 052925Trading Idea
1) Find a FIBO slingshot
2) Check FIBO 61.80% level
3) Entry Point > 69/61.80%
Chart time frame:D
A) 15 min(1W-3M)
B) 1 hr(3M-6M)
C) 4 hr(6M-1year)
D) 1 day(1-3years)
Stock progress: A
A) Keep rising over 61.80% resistance
B) 61.80% resistance
C) 61.80% support
D) Hit the bottom
E)

Yen's Rate is Crawling Like a Speeding Crab.The rapid advancement of Japanese technology appears to be mirrored in the dynamic movement of the Yen index.
This index has swiftly reached the 1.276 Fibonacci level (71.3), and following a brief consolidation, it is now projected to advance towards the subsequent golden ratio at the 1.618 Fibon

I continue to sell JPY pairs (go long the yen)I've been long the JPY since the beginning of 2025. I recently closed an incredible OANDA:NZDJPY short position, which was very rewarding. Currently, I'm short CADJPY, CHFJPY, EURJPY, and GBPJPY.
My bullish bias for the yen continues. The yen index recently closed above a key horizontal level, s

Buy the Yen!If you've been following my content, you'll know I've been long the yen since the start of 2025. My short AUDJPY, CADJPY, EURJPY, NOKJPY, and NZDJPY positions are starting to pay off!
The yen index ( TVC:JXY ) recently closed above a key horizontal resistance at 66.00. This may signal the JPY ma

Rci Signal
Description:
The RCI Signals indicator helps identify clear Buy and Sell signals by leveraging the RCI (Rank Correlation Index) technical analysis tool. By tracking the price ranking relationships across three different timeframes (short, mid, and long), this indicator supports traders in detectin

The Yen Crash Could be Finally Over.The Yen index trades at a really interesting level as we head into the BoJ rates decision.
We're trading at the 1.61 extension of the previous bull trap.
This is a big make or break level. A lot of consideration does have to be given towards the bear break. In a bear break the 1.61 hits. 1.27 of

#JXY $JPY waiting a good days soon #Japan My expectations for the #JPY dollar in the next 2 months God wi
Maybe I'm wrong but I taking it

See all ideas
Displays a symbol's price movements over previous years to identify recurring trends.
Frequently Asked Questions
PHLX Yen reached its highest quote on Oct 27, 2011 — 132.18 USD. See more data on the PHLX Yen chart.
The lowest ever quote of PHLX Yen is 61.75 USD. It was reached on Jul 3, 2024. See more data on the PHLX Yen chart.
PHLX Yen is just a number that lets you track performance of the instruments comprising the index, so you can't invest in it directly. But you can buy PHLX Yen futures or funds or invest in its components.