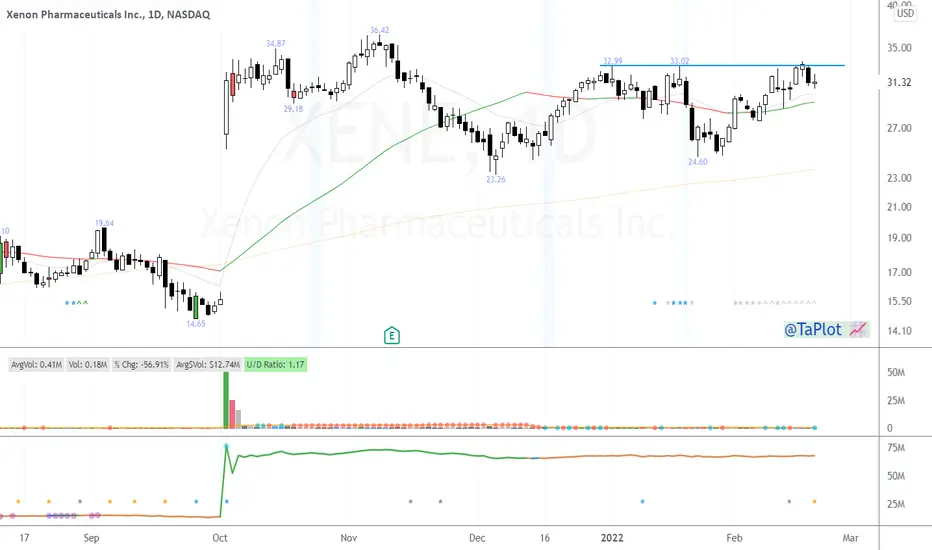
$XENE showing signs of going higher after a long consolidation!Notes:
* Strong up trend
* Okay earnings track record
* Consolidating for the past ~9months
* Bouncing from its 50 day line with bullish momentum
Technicals:
Sector: Healthcare - Biotechnology
Relative Strength vs. Sector: 1.73
Relative Strength vs. SP500: 1.32
U/D Ratio: 1.97
Base Depth: 36.27%
Distance from breakout buy point: -1.16%
Volume 19.91% above its 15 day avg.
Trade Idea:
* You can enter now as the price is still close to the 50 day line
* If you're looking for a better entry you can look for one around the $32.76 area as that seems to be a pivot
* This stock usually has local tops when the price closes around 33.16% above its 50 EMA
* Consider selling into strength if the price closes 32.96% to 33.36% (or higher) above its 50 EMA
* The last closing price is 10.55% away from its 50 EMA
XENE trade ideas

$XENE Another Strong Biotech SetupSimilar story with $XENE - another Biotech building a strong base breakout setup.
Manage risk aggressively on these biotechs, they will move fast.
Don't hold and hope if they turn against you and wait for tight risk entry
XENE - Coiling.. XENE is consolidating in a triangle pattern since Feb. Has been a big volume spike recently. It is a biotech play so risky by nature but as long as we can keep on moving above the EMA's I am wanting to take a long when volume steps in or when a break occurs to the upside.

Blue Sky Breakout on High Relative VolumeProfit target is proportional to the relative volume. My detailed trade is shown on chart.
If you like my content please like, follow, and donate coins so I can keep my pro membership.
Thank you.

Xenon Pharmaceuticals Announces Positive Topline Results from PhXENE: Xenon Pharmaceuticals Inc.
2021-10-04 07:00:00
Xenon Pharmaceuticals Announces Positive Topline Results from Phase 2b ‘X-TOLE’ Clinical Trial of XEN1101 for the Treatment of Focal Epilepsy

XENE, Triangle Descending (bullish)I found this pattern at tickeron website with the following data:
STATUS = Confirmed
CURRENT CONFIDENCE = 70%
TARGET (EXIT) PRICE = 12.07 USD
BREAKOUT (ENTRY) PRICE = 11.44 USD
DISTANCE TO TARGET PRICE = 3.89%
EMERGED ON = Sep 29, 12:00 PM (EDT)
CONFIRMED ON = Oct 02, 09:43 AM (EDT)
WITH CONFIDENCE LEVEL = 79%
The Descending Triangle pattern is formed when the price of a security establishes a support level (1, 3, 5) and bounces off that level to a declining resistance level, creating a down-sloping top line (2, 4). The breakout can either be up or down, depending if the resistance or highest support level is broken first.
This pattern is commonly associated with directionless markets since the contraction (narrowing) of the market range signals that neither bulls nor bears are in control.
Trade idea
Once the price breaks out from the top pattern boundary, day traders and swing traders should trade with an UP trend. Consider buying a security or a call option at the breakout price level. To identify an exit, compute the target price by adding the pattern height from breakout point. For upward breakouts the level is the highest high within the triangle (2). Pattern height is the difference between the level of the bottom horizontal line and the highest high.
To limit potential loss when price suddenly goes in the wrong direction, consider placing a stop order to sell at or below the breakout price.

XENE - Momentum breakout long from 10.56 XENE - Possible long here or pullback to 10.56. stop signal 9.83

long rounding reboundI think Xenon hit bottom and now it has been climbing steadily for the last 4 months, every week except one has finished higher. In the last week it appears an ascending triangle has formed and the price has marched on upwards again. I try to be careful so I'll look at the 5-year info on the marketwatch site, then do a search for info on their pain-meds research; if I don't find anything that screams "looming danger" I'll have to risk some of my meagre stake.
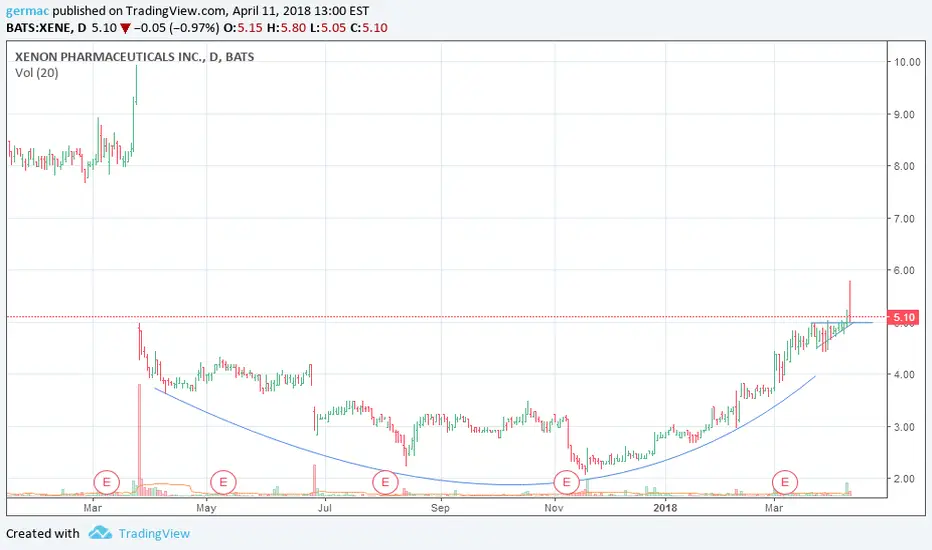
XENE - fallen angel pattern Long from $2.91 to $3.43 XENE seems breaking out of its downward channel formation. Twiggs money flow crossing to the positive side, and it has insider buying.
We think it has good upside potential.
* Trade Criteria *
Date First Found- December 26, 2017
Pattern/Why- downward channel breakout, fallen angel pattern.
Entry Target Criteria- Current price ($2.91), Ideally look for a pullback
Exit Target Criteria- 1st Target $3.43, 2nd Target $4.43
Stop Loss Criteria- N/A
Indicator Notes- Very strong Twiggs money flow index.
Special Note- Some insider buying
Please check back for Trade updates. (Note: Trade update is little delayed here.)


Zombie TwitchLittle zombie twitch going on here. Could be worth a watch for more. Very thin zombie though, which is even more dangerous so be careful...
