XFOR Symmetrical Triangle Breakout Setup- Potential Upside Move.XFOR is forming a symmetrical triangle pattern on the 30-minute timeframe, signaling a potential breakout. The price is consolidating near the apex, and a breakout above the resistance level at $0.7587 could trigger an upside move toward $0.8757.
Entry: $0.70 (Breakout confirmation)
Stop Loss (SL):
Next report date
—
Report period
—
EPS estimate
—
Revenue estimate
—
2.27 USD
−37.45 M USD
2.56 M USD
3.86 M
About X4 Pharmaceuticals, Inc.
Sector
Industry
CEO
Paula S. Ragan
Website
Headquarters
Boston
Founded
2010
FIGI
BBG001J1CYH8
X4 Pharmaceuticals, Inc. is a late clinical-stage company, which engages in the development and discovery of novel therapeutics for the treatment of rare diseases and those with limited treatment options. Its clinical candidate is mavorixafor. The company was founded by Henri A. Termeer, Keith T. Flaherty, Renato T. Skerlj, Richard Peters and Paula Ragan in 2010 and is headquartered in Boston, MA.
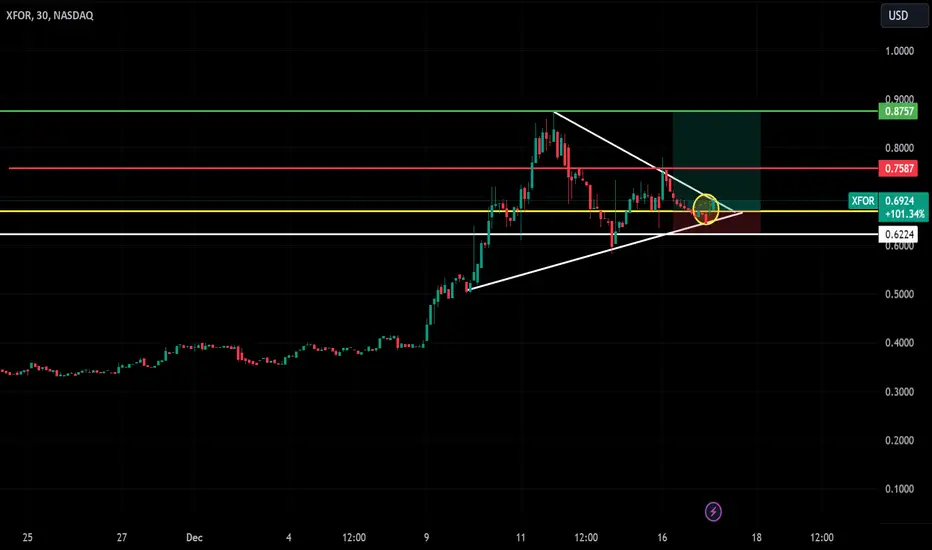
XFOR is in the HouseSee the comments on the chart; I intentionally left my chart clean as I see this as a great stock for a training session.
If you are interested, leave a note in the comments.
As always, enjoy every sandwich with a great drink ;)

XFOR - 140% UPSIDE- Triangle breakout
- buy pullbacks dips
- Tipranks Analyst rating $22 median price target
- The FDA has designated Rare Pediatric Disease status to X4 Pharmaceuticals (XFOR -2.4%) for its lead asset, mavorixafor, for the treatment of WHIM (Warts, Hypogammaglobulinemia, Infections, and Myelokathex

See all ideas
Summarizing what the indicators are suggesting.
Neutral
SellBuy
Strong sellStrong buy
Strong sellSellNeutralBuyStrong buy
Neutral
SellBuy
Strong sellStrong buy
Strong sellSellNeutralBuyStrong buy
Neutral
SellBuy
Strong sellStrong buy
Strong sellSellNeutralBuyStrong buy
An aggregate view of professional's ratings.
Neutral
SellBuy
Strong sellStrong buy
Strong sellSellNeutralBuyStrong buy
Neutral
SellBuy
Strong sellStrong buy
Strong sellSellNeutralBuyStrong buy
Neutral
SellBuy
Strong sellStrong buy
Strong sellSellNeutralBuyStrong buy
Displays a symbol's price movements over previous years to identify recurring trends.
Related stocks
Frequently Asked Questions
The current price of XFOR is 2.82 USD — it has decreased by −7.54% in the past 24 hours. Watch X4 Pharmaceuticals, Inc. stock price performance more closely on the chart.
Depending on the exchange, the stock ticker may vary. For instance, on NASDAQ exchange X4 Pharmaceuticals, Inc. stocks are traded under the ticker XFOR.
XFOR stock has fallen by −26.37% compared to the previous week, the month change is a −16.81% fall, over the last year X4 Pharmaceuticals, Inc. has showed a −91.38% decrease.
We've gathered analysts' opinions on X4 Pharmaceuticals, Inc. future price: according to them, XFOR price has a max estimate of 120.00 USD and a min estimate of 7.00 USD. Watch XFOR chart and read a more detailed X4 Pharmaceuticals, Inc. stock forecast: see what analysts think of X4 Pharmaceuticals, Inc. and suggest that you do with its stocks.
XFOR reached its all-time high on Mar 22, 2019 with the price of 717.90 USD, and its all-time low was 2.67 USD and was reached on May 20, 2025. View more price dynamics on XFOR chart.
See other stocks reaching their highest and lowest prices.
See other stocks reaching their highest and lowest prices.
XFOR stock is 8.93% volatile and has beta coefficient of 1.05. Track X4 Pharmaceuticals, Inc. stock price on the chart and check out the list of the most volatile stocks — is X4 Pharmaceuticals, Inc. there?
Today X4 Pharmaceuticals, Inc. has the market capitalization of 16.32 M, it has increased by 13.55% over the last week.
Yes, you can track X4 Pharmaceuticals, Inc. financials in yearly and quarterly reports right on TradingView.
X4 Pharmaceuticals, Inc. is going to release the next earnings report on Jul 31, 2025. Keep track of upcoming events with our Earnings Calendar.
XFOR earnings for the last quarter are 0.04 USD per share, whereas the estimation was −3.55 USD resulting in a 101.13% surprise. The estimated earnings for the next quarter are −2.48 USD per share. See more details about X4 Pharmaceuticals, Inc. earnings.
X4 Pharmaceuticals, Inc. revenue for the last quarter amounts to 28.81 M USD, despite the estimated figure of 11.58 M USD. In the next quarter, revenue is expected to reach 1.73 M USD.
XFOR net income for the last quarter is 282.00 K USD, while the quarter before that showed −39.82 M USD of net income which accounts for 100.71% change. Track more X4 Pharmaceuticals, Inc. financial stats to get the full picture.
No, XFOR doesn't pay any dividends to its shareholders. But don't worry, we've prepared a list of high-dividend stocks for you.
As of Jun 14, 2025, the company has 143 employees. See our rating of the largest employees — is X4 Pharmaceuticals, Inc. on this list?
EBITDA measures a company's operating performance, its growth signifies an improvement in the efficiency of a company. X4 Pharmaceuticals, Inc. EBITDA is −112.32 M USD, and current EBITDA margin is −5.50 K%. See more stats in X4 Pharmaceuticals, Inc. financial statements.
Like other stocks, XFOR shares are traded on stock exchanges, e.g. Nasdaq, Nyse, Euronext, and the easiest way to buy them is through an online stock broker. To do this, you need to open an account and follow a broker's procedures, then start trading. You can trade X4 Pharmaceuticals, Inc. stock right from TradingView charts — choose your broker and connect to your account.
Investing in stocks requires a comprehensive research: you should carefully study all the available data, e.g. company's financials, related news, and its technical analysis. So X4 Pharmaceuticals, Inc. technincal analysis shows the strong sell today, and its 1 week rating is strong sell. Since market conditions are prone to changes, it's worth looking a bit further into the future — according to the 1 month rating X4 Pharmaceuticals, Inc. stock shows the sell signal. See more of X4 Pharmaceuticals, Inc. technicals for a more comprehensive analysis.
If you're still not sure, try looking for inspiration in our curated watchlists.
If you're still not sure, try looking for inspiration in our curated watchlists.