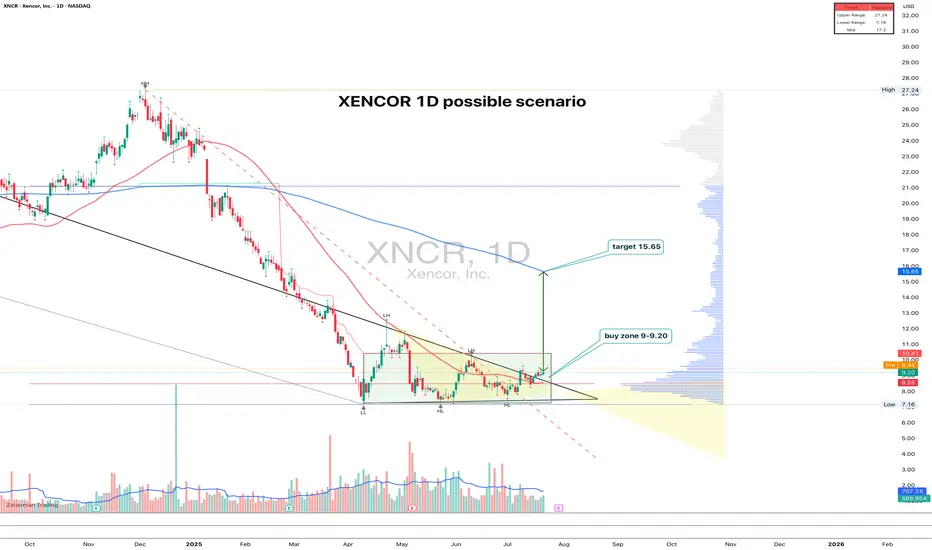
XNCR 1D time to growth?XNCR: the uptrend hasn't started yet - but someone's quietly accumulating
XNCR spent nearly 4 months building a base and finally broke out of consolidation with a clear upward move. The pattern looks like a range with a narrowing triangle at the bottom — the breakout came with rising volume. Entry
Next report date
—
Report period
—
EPS estimate
—
Revenue estimate
—
−2.42 USD
−232.62 M USD
110.49 M USD
66.77 M
About Xencor, Inc.
Sector
Industry
CEO
Bassil I. Dahiyat
Website
Headquarters
Pasadena
Founded
1997
FIGI
BBG0026ZG4W0
Xencor, Inc. is a biopharmaceutical company, which engages in the development of engineered monoclonal antibody therapeutics to treat severe and life-threatening diseases. Its proprietary technology platform, XmAb, is used to create next-generation antibody product candidates designed to treat autoimmune and allergic diseases, cancer, and other conditions. The company was founded by Bassil I. Dahiyat and Stephen L. Mayo in August 1997 and is headquartered in Monrovia, CA.
Related stocks
i just got done watching the hustler starring paul newmanthe epic head and shoulders setup, neckline @ ~20 dollars

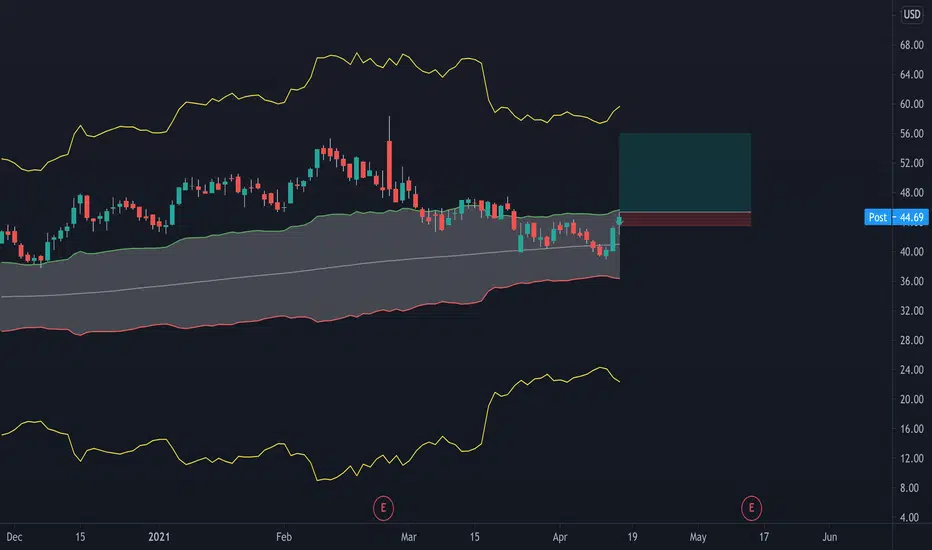
XNCR: Breakout Confirmed, 23.38% Potential Profit!Description: XNCR is trending higher and in an uptrend meaning that highs are getting higher and lows are getting higher. The uptrend line on the chart and the Trending Band Indicator (which measures trend) supports the Long Position.
Stats:
1. Ideal buy range: $44.6 - $46.4
2. Take profit: $55.56

XNCR Long Buy Zone: $30.30 to $28.32
Stop loss: $24.50
Target: $44 to $48
Position Size: 20%/100%
Best of luck

Sell XNCRDaily shooting star
No confluence on Stoch or MACD
S/L 40.19
T/P 35.45
R/R 1
Profit Trading

Trading a pullback in XNCRSo this has been rangebound for a long time, before gaining some good upside momentum in februry. It's been consolidating since then, until now. A breakout from DT line provides an entry for the next upswing, which I expect should be something similar to the first one.
Entry: now, or on further ups


XNCR- Looking 4 Buying Opportunity Look at what happens when Insider John S Stafford III (10% owner) starts buying shares/stocks. Price action soon goes up. Violet area noted on chart is a major support area and coming up early in November is earnings, if you are interested into this stock- please do your own research. Happy Trading

XNCR- Descending Triangle (Short) A descending triangle pattern is shown, shorting the stock would be the way to go considering that it has 2 reaction low points. Although they are not exact, they are within reasonable proximity of each other, which makes the pattern valid. I would short ASAP and set an expiration date for about a m

See all ideas
Summarizing what the indicators are suggesting.
Neutral
SellBuy
Strong sellStrong buy
Strong sellSellNeutralBuyStrong buy
Neutral
SellBuy
Strong sellStrong buy
Strong sellSellNeutralBuyStrong buy
Neutral
SellBuy
Strong sellStrong buy
Strong sellSellNeutralBuyStrong buy
An aggregate view of professional's ratings.
Neutral
SellBuy
Strong sellStrong buy
Strong sellSellNeutralBuyStrong buy
Neutral
SellBuy
Strong sellStrong buy
Strong sellSellNeutralBuyStrong buy
Neutral
SellBuy
Strong sellStrong buy
Strong sellSellNeutralBuyStrong buy
Displays a symbol's price movements over previous years to identify recurring trends.
Frequently Asked Questions
The current price of XNCR is 7.32 USD — it has decreased by −2.27% in the past 24 hours. Watch Xencor, Inc. stock price performance more closely on the chart.
Depending on the exchange, the stock ticker may vary. For instance, on NASDAQ exchange Xencor, Inc. stocks are traded under the ticker XNCR.
XNCR stock has fallen by −14.39% compared to the previous week, the month change is a −8.04% fall, over the last year Xencor, Inc. has showed a −59.71% decrease.
We've gathered analysts' opinions on Xencor, Inc. future price: according to them, XNCR price has a max estimate of 40.00 USD and a min estimate of 6.00 USD. Watch XNCR chart and read a more detailed Xencor, Inc. stock forecast: see what analysts think of Xencor, Inc. and suggest that you do with its stocks.
XNCR reached its all-time high on Feb 24, 2021 with the price of 58.35 USD, and its all-time low was 5.75 USD and was reached on Dec 3, 2013. View more price dynamics on XNCR chart.
See other stocks reaching their highest and lowest prices.
See other stocks reaching their highest and lowest prices.
XNCR stock is 12.31% volatile and has beta coefficient of 2.05. Track Xencor, Inc. stock price on the chart and check out the list of the most volatile stocks — is Xencor, Inc. there?
Today Xencor, Inc. has the market capitalization of 533.07 M, it has decreased by −4.85% over the last week.
Yes, you can track Xencor, Inc. financials in yearly and quarterly reports right on TradingView.
Xencor, Inc. is going to release the next earnings report on Nov 10, 2025. Keep track of upcoming events with our Earnings Calendar.
XNCR earnings for the last quarter are −0.41 USD per share, whereas the estimation was −0.72 USD resulting in a 43.04% surprise. The estimated earnings for the next quarter are −0.70 USD per share. See more details about Xencor, Inc. earnings.
Xencor, Inc. revenue for the last quarter amounts to 43.61 M USD, despite the estimated figure of 22.59 M USD. In the next quarter, revenue is expected to reach 29.81 M USD.
XNCR net income for the last quarter is −30.82 M USD, while the quarter before that showed −48.42 M USD of net income which accounts for 36.34% change. Track more Xencor, Inc. financial stats to get the full picture.
No, XNCR doesn't pay any dividends to its shareholders. But don't worry, we've prepared a list of high-dividend stocks for you.
As of Aug 8, 2025, the company has 250 employees. See our rating of the largest employees — is Xencor, Inc. on this list?
EBITDA measures a company's operating performance, its growth signifies an improvement in the efficiency of a company. Xencor, Inc. EBITDA is −133.34 M USD, and current EBITDA margin is −150.51%. See more stats in Xencor, Inc. financial statements.
Like other stocks, XNCR shares are traded on stock exchanges, e.g. Nasdaq, Nyse, Euronext, and the easiest way to buy them is through an online stock broker. To do this, you need to open an account and follow a broker's procedures, then start trading. You can trade Xencor, Inc. stock right from TradingView charts — choose your broker and connect to your account.
Investing in stocks requires a comprehensive research: you should carefully study all the available data, e.g. company's financials, related news, and its technical analysis. So Xencor, Inc. technincal analysis shows the sell today, and its 1 week rating is sell. Since market conditions are prone to changes, it's worth looking a bit further into the future — according to the 1 month rating Xencor, Inc. stock shows the sell signal. See more of Xencor, Inc. technicals for a more comprehensive analysis.
If you're still not sure, try looking for inspiration in our curated watchlists.
If you're still not sure, try looking for inspiration in our curated watchlists.