XNCR 1D time to growth?XNCR: the uptrend hasn't started yet - but someone's quietly accumulating
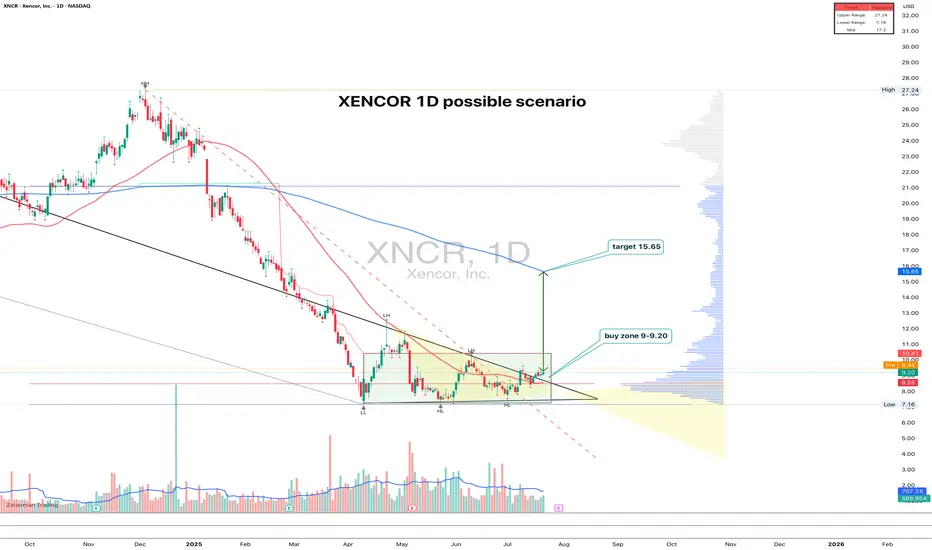
XNCR spent nearly 4 months building a base and finally broke out of consolidation with a clear upward move. The pattern looks like a range with a narrowing triangle at the bottom — the breakout came with rising volume. Entry makes sense in the 9.00–9.20 zone on a retest. Volume profile and Fib levels confirm the importance of this area, plus there’s a clean support shelf at 9.00. The target is 15.65, which aligns with the height of the structure. The 200-day MA is still above price, but a push beyond 11.00 could open the door to acceleration.
Fundamentally, Xencor is a biotech company focused on monoclonal antibodies. After a tough 2023–2024 and cost reductions, the market is beginning to price in signs of recovery. Key partnerships remain intact, the pipeline is alive, and recent data for XmAb7195 was well received at industry events. Valuation remains low, and biotech ETF flows are slowly picking up.
Still a relatively low-volume name, but the structure is clean, the setup is readable, and fundamentals are turning. With a tight stop below 8.50, the risk-reward looks solid.
XNCR trade ideas
i just got done watching the hustler starring paul newmanthe epic head and shoulders setup, neckline @ ~20 dollars

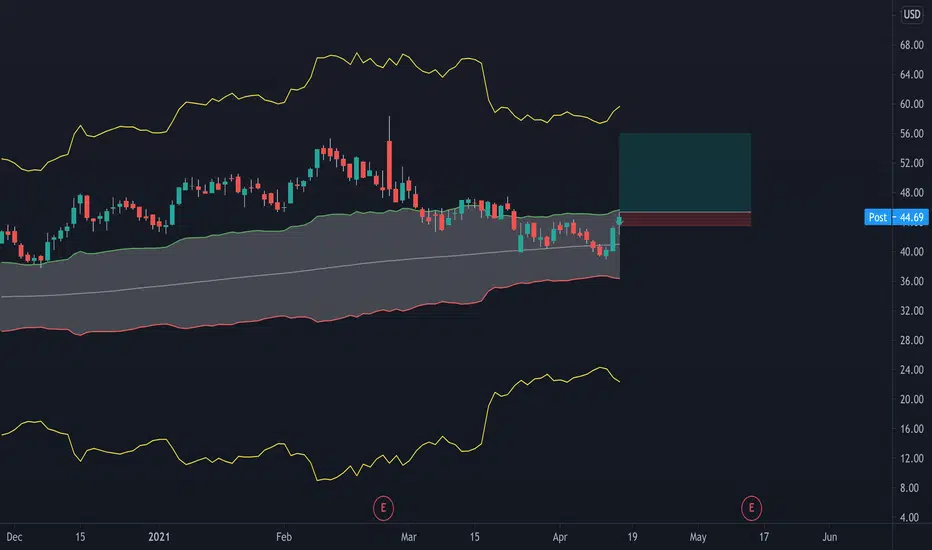
XNCR: Breakout Confirmed, 23.38% Potential Profit!Description: XNCR is trending higher and in an uptrend meaning that highs are getting higher and lows are getting higher. The uptrend line on the chart and the Trending Band Indicator (which measures trend) supports the Long Position.
Stats:
1. Ideal buy range: $44.6 - $46.4
2. Take profit: $55.56
3. Stop Loss: $43.03
4. Risk To Reward: 1 / 6
5. Accuracy Rating: 94%

XNCR Long Buy Zone: $30.30 to $28.32
Stop loss: $24.50
Target: $44 to $48
Position Size: 20%/100%
Best of luck

Sell XNCRDaily shooting star
No confluence on Stoch or MACD
S/L 40.19
T/P 35.45
R/R 1
Profit Trading

Trading a pullback in XNCRSo this has been rangebound for a long time, before gaining some good upside momentum in februry. It's been consolidating since then, until now. A breakout from DT line provides an entry for the next upswing, which I expect should be something similar to the first one.
Entry: now, or on further upside momentum
Trailing stop-loss 3 ATR from entry
1x target at previous pivot high, 2x target at 39


XNCR- Looking 4 Buying Opportunity Look at what happens when Insider John S Stafford III (10% owner) starts buying shares/stocks. Price action soon goes up. Violet area noted on chart is a major support area and coming up early in November is earnings, if you are interested into this stock- please do your own research. Happy Trading.

XNCR- Descending Triangle (Short) A descending triangle pattern is shown, shorting the stock would be the way to go considering that it has 2 reaction low points. Although they are not exact, they are within reasonable proximity of each other, which makes the pattern valid. I would short ASAP and set an expiration date for about a month.
Price prediction: low $21.00s within a month time period.
