Zillow Inc - Z - Daily - Coming off a base with lower valuationZillow is at the low end of its one year "valuation range" of 14-13 times sales. This PSR is the Price-to-Sales-Ratio and is a measure of the market cap (Price) to the revenues (Sales) of the stock. It is a helpful measuring tool.
Zillow has unfurled and come under pressure after the announcement about merging with Trulia. Since then it has fallen from 150+ down to the 105 level.
CCI (Commodity Channel Index) is a pure technical measurement of price against its 21 day moving average) is turning up, which suggests that downside momentum is waning.
Earnings are due in early November. There is a key level of resistance up at the $125 level and a level I am targeting for a move higher from the 109 level now. I view downside risk as the $100 level. Upside of 15 pts, vs 9 pts of downside. I would be buying a drop to 103 also as that is a big support level also.
Tim
108.96 last 3:27PM EST 10/23/2014
Z trade ideas


This Is Why Zillow (NASDAQ:Z) Is BouncingZillow Inc (NASDAQ:Z) is bouncing today off the key $100 level. If you saw the chart, you would have expected it. Why? Simply look at the chart below and note the major support at the $100 level. If there was going to be a bounce in Zillow, this was going to be it. Will it bounce more? Yes, it should bounce back to $112+.
Gareth Soloway
Chief Market Strategist
www.InTheMoneyStocks.com

Zillow: Support Levels Tagged after Price BreakdownSee our original blog post published last weekend: www.syncubate.com
When Zillow's stock closed below $123 on the weekly chart, we noted in our analysis that this was a key bearish development and to watch for the $113 and $110 support levels to potentially be tagged soon after.
Last week, Zillow traded as low as $110.56 and closed Friday's session at $112.73, just under $113.
To see more of our market commentaries and analyses, subscribe to our blog here: www.syncubate.com

Zillow Breaks Below Key Chart SupportFor detailed commentary and analysis, see our blog post published 9/27/2014: www.syncubate.com
Last week, Z tagged the $123 support area and bounced off of it, to close the week out at $130.97. However, there was no carry-over in bullish momentum. The stock has since fallen below $123, finishing Friday's trading session at $121.75.
Friday's close is significant in that the $123 level had been fiercely defended by the bulls on the weekly chart multiple times since June, as noted by the blue arrows.
Stay up to date and subscribe to our blog to receive the latest posts via email: www.syncubate.com


Z - Remains Strong - Will It?Zillow still remains strong, but has lost all the gain from the trulia merger news. Will it remain strong?

Why Timing is Everything in the MarketFor a detailed commentary and analysis, please refer to our blog post published 7/27/14: www.syncubate.com
Zillow made headlines last week on a possible merger with Trulia, and the stock has since surged in value to nearly $160 a share. The buyout of Trulia was confirmed earlier today.
On the weekly chart, the stock's price fluctuations show a bull trend picking up steam in the beginning of 2014. From that point forward, +DMI has remained above -DMI, conveying the persistent strength of the bulls over the bears.
Timing is everything in the market - in our latest blog post, we discuss why traders must respect time in their trade planning, highlighting our analysis of Zillow's daily chart versus weekly chart.

REPUBLISHING Zillow Z Daily - Solid Uptrend, Cup&HandleInteresting news today with the merger of Zillow and Trulia (TRLA):
The combination of companies is still showing zero profits.
Either way, a free gift of a rally here has Zillow stretched beyond "trend" so I would suggest walking away or writing calls for as long as possible "AT THE MONEY" to capture as much premium as possible.
1 year call premiums might be 20% for at the money options and I think that is a decent return.
Cheers.
Tim 4:17PM EST 7/24/2014 145.76 last


Zillow: Trending Move AnalysisIn reviewing the daily chart for Z, the strong uptrend since the middle of May has continued without any significant sell off. Note that there are several price levels to keep an eye on during any pullback, as noted on the chart.
In the near term, the $140 and $130/$132 levels are support. The stock broke through $140 with conviction early last week after struggling with it the week before. Despite pulling back from the highs and retesting $140, the stock held above it for the close on 7/3/14.Seems the stock wants higher still.
Blog post dated 07/05/2014: www.syncubate.com

ZThere is no new signal at moment but as far as there is no real sign of a correction I assume that the trend will continue.

Upper Channel on Aggresive Valuation.Most aggressive pt have recently been boosted to 130 on the possibility of a consolidation with Trulia. But most conservative pt around 110-115 state the already embedded high valuation in Zillow given projected growth. New-home sales surged in May, but the gains only put the market back on track to match last year's pace along with many investors speculating about mortgage rate hikes. I don't see the logic in investing at these all time highs and I don't believe many growth investors do either. I think it's currently being pushed up by bull swing traders who are enjoying the short squeeze. Forming a bearish rising wedge at the top of this multi-year channel I do believe anything above 135 is a good short with a stop of 140.

Zillow Inc Z Daily - UPTREND - STEADY AS SHE GOES!User DavideG published a nice chart on Zillow today which made me take a look at the chart.
I could tell right away I liked it on a pullback, so I did some work and here is what I have so far.
Take a look and see what you think:
Zillow looks great to my eye. Buy on a pullback to 101. Buy on any dips under 105. Buy on ....... and Buy on .......
Plus there is a big cup&handle formation that it broke out from.
Also note the 1-year EARNINGS TREND Lines I put in the chart. Note how it is just plugging along on those. Fascinating.
Tim
5:06PM EST Monday, May 19, 2014

Zillow - Rally Nearing CompletionZillow has been unable to rise more than 29.5% in the last year without undergoing a correction. Specifically, each rally of ~28% ends with a correction of at least 16%. Since the last bottom on May 8th, Zillow has appreciated 22%. Patiently waiting for rise to $115-118, marked by red box, for short sale.
Targeting return to the 50SMA, which has proved to be a significant support level. Note how Zillow has bounced off of its 50 SMA six times since late-March. Also important to watch the RSI, which has similarly found support at the lower trend line which has been intact since December.
I've used this pattern in conjunction with the 50SMA and RSI channel to identify short and long entries successfully before and optimistic this remains a good system.
5.19.14 - 3:58PM EST
Davide

Zillow lower?Seems to be near decision where it was decided to be too expensive in the past. Lower highs; possible bearish Harmonic patterns on weekly/hourly. Or, could see a nice fake out at the next high. Interesting to see :)


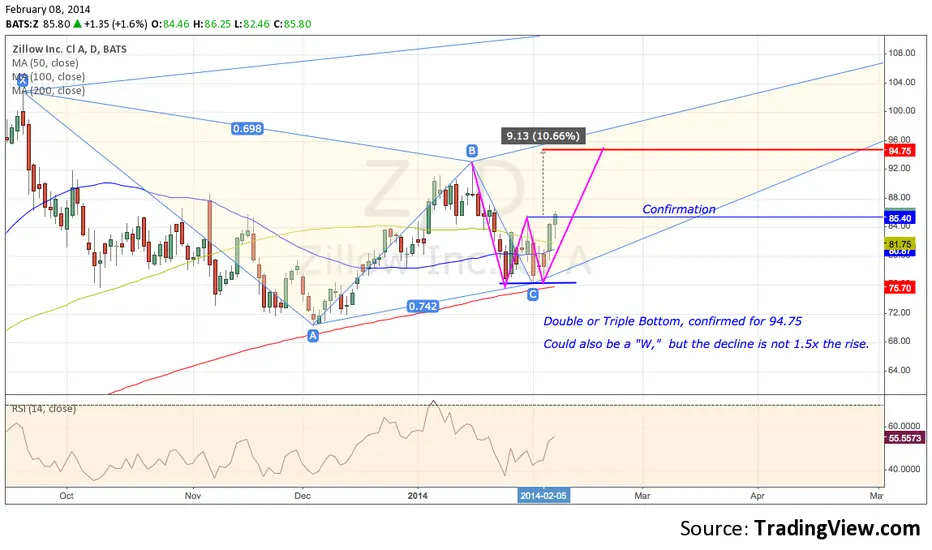
ZAnother chart this didn't "publish" for some reason. The close up of the double bottom did, but this is a weekly view


Housing playLooks decent. Largest trade was x98 Jan 80 C at the ask 3.20 ...Jan 70 P traded at the mid, 2x100. 3k c vs 2.2k P. More OI in the Jan calls side...Odd OI in the jan 22.5 P. Positive divergence on hourly charts. Stalking...
