Z trade ideas

Z - Falling Wedge for the Win?!WEEKLY CHART
This is a classic falling wedge pattern! (I'm a little late to the party.)
- Strong volume
- Break above $107.10 (break above 50MA) should confirm a continuation of the bullish trend.
- 50MA could create some resistance around $101-$103.
I like Z $120 Call 1/21/22. I'm already in. (avg. $2.40)

Zillow - Time to print some spreads on calls!-Faced with the fastest-rising real estate prices in U.S. history, Zillow Group Inc. tweaked the algorithms that power its home-flipping operation to make higher offers.
-It ended up with so many winning bids that it had to stop making new offers on properties. Now, after buying more homes in the third quarter than it ever has before, the company is working through a backlog of houses that need to be fixed up and sold while facing an unpleasant reality: Slowing price appreciation means it will sell many homes at a loss.
-That being said, we don't expect any major growth from Zillow in upcoming months.

Zillow can't handle the heat! Another Canary.
Zillow has suspended its iBuying program, Zillow Offers, cited building backlogs and labor/supply shortages as the reason. I believe Zillow's actions supports the idea of a weakening housing market. Weakness in the housing market is attributed to dampening economic conditions.
Zillow's iBuying program started in April 2018 and represented the newest frontier in real estate technology. Zillow previously made money from online advertisements and providing leads to agents. iBuying stands for Instant Buying. Zillow commands a huge amount of data which, allows them to use algorithms to automate the home buying process. This iBuying program quickly turned into Zillows biggest source of revenue and led to countless valuation upgrades. This is not surprising in an environment where: year over year home price appreciation and prices adjusted for inflation are at its highest levels ever. From starting the program in April 2018 to the peak in 2021 was a 600% move. So why would Zillow get rid of their most successful and profitable business?
I don't believe Zillow is stopping because of operational capacity. Zillow's data regarding the housing market is as good as the US Government's; they can manage their inventory and new purchases without having to stop the program. Why not just slow it down temporarily. I think this has more to do than labor and material shortages. Maybe they see trouble on the horizon and houses are not the asset you want to hold especially if you bought it at the top. Q3 and Q4 are going to be horrible earning seasons for them. They want to get out before, things get even worse.
Now that interest rates are increasing, moratoriums expiring and the normalization of lumber prices all lead to lower housing costs. You can see the problem Zillow is facing for yourself. The Zillow homes in places like Phoenix, Northern Colorado, Florida are all being relisted by Zillow with price 2%-10% price cuts. Zillow is selling all of these homes for less than they bought it for. My friend sold one of his rental properties in Sacramento to Zillow in July 2021 and they still are not able to sell it and cut the price by 15K. Zillow was the one contributing to inflating this housing bubble until, they realized that the housing market was going back to its fundamental valuation and they do not want to be the ones holding the bag.
Speaking about those with the data and information selling. Jerome Powell, got caught again with insider trading AGAIN. A report came out that before the October downturn last year, Powell dumped his positions. We already other regional fed presidents like Kaplan, Rosenbran, Clarita were trading stocks during 2020 when the fed was heavily influencing markets. Who is there to keep them accountable? Nancy Pelosi??? Everybody in the top tier of the government are as crooked as Powell. The people in charge of the fed, gov are all ex Goldman, JP, Blackstone. It is crazy to me that Powell is not in jail? Get him out Biden!

Zillow (Z) - Midterm Long idea - consider RRRHi Traders, everything is in the Chart.
Zillow G. is forming Ending diagonal in Wave C reaching GOlden pocket retracement. 0.618-0.65 what is always good sign for trend reversal.
1D RSI alredy shows RSI konvergce, (3D probaby also) - still waiting for 1W TimeFrame.
COnsider your RRR and how much you trust to Patterns. CThis could be good setup for profit around 70%.
Trade safe and enjoy the game ;)

Zillow is a falling knifeOver the weekend it was reported ZILLOW PAUSES HOME PURCHASES AS SNAGS HIT TECH-POWERED FLIPPING
For those not familiar with NASDAQ:Z 's recent business model they have been on a buying frenzy no doubt fueled by low interest credit to give home sellers fast cash offers on houses based on prices that Zillow determines via their machine learning algorithms. It is a bold strategy Cotton; let's see if it pays off! That buying which has been going on unabated for months with ever rising prices seems to have hit a dip.
I would not call this the "top of the housing market" by any means but it is a data point we can refer back to should the future prove it to be a top.
Technically speaking the chart of Zillow is not pretty. I was long Zillow on the 50% Retracement over the summer but abandoned the position as it solidly broke the level. I am content to be out as it grinds lower from a risk management perspective. This is yet another reason to not baghold.
I would look for signs of reversal to perhaps get back in at a future time but right now price action on the broader trend is in no-man's land.


$Z time to long this breakoutRSI breakout; and breakout imminent on falling wedge setup.
Holding 100c 5/22 LONG.
Housing market is not going to slow down. This has had a significant pullback in the last year.

Early stages..Long downward wicks suggesting a possible reversal - my eyes are still at 70.. Zillow gets quite a bit of dip-buyers with all of the press around them


$Z HTF ACB LongMonthly - 0.618 Fib
Weekly - Support
Daily - Wave 5 completion/Descending triangle/Double bottom/MACD/Bullish Engulfing
LTF - Descending triangle Breakout/MACD/Double bottom
RR - 8 (Previous M/W highs)
Management - Long term

Z - Zillow Group IncZillow will continue to drop as long as there are price reductions and they lose money on their shady deals. They've been lying to everyone about how the housing market is secure and going to continue to boom.
Apart from their imminent downfall for the remainder of this year, the market itself is going to crash:
If we look at the current state of the market, the Market Cap to GDP Ratio is extraordinarily high:
Bubble Highs:
- DotCom Bubble: 139.5%
- 2008 Crash: 100.3%
- 2021+: 186.0%+
Historic Average:
- Average: ~85%
To be fairly valued, the market would need to drop around 60%.
Wilshire 5000 Total Market Inde (^W5000) = $45,313.82
Title: Gross Domestic Product
Series ID: GDP
Source: U.S. Bureau of Economic Analysis
Release: Gross Domestic Product
Seasonal Adjustment: Seasonally Adjusted Annual Rate
Frequency: Quarterly
Units: Billions of Dollars
Date Range: 1947-01-01 to 2021-04-01
Last Updated: 2021-08-26 7:51 AM CDT
Notes: BEA Account Code: A191RC
GDP = 22,731.369 as of 2021-04-01
(45,313.82 / 22,731.369) * 100 = 199.344879%
Even if we were being more conservative about it, (45,313.82 / 25,000.00) * 100 = 181.25528%
Buy back in when everything is on sale.

Zillow Group Falling Wedge1. Falling wedge breakout?
2. Testing 0.618 retracement?
3. If not then road to $60 is open.

Which Real Estate Technology Platform Stock to Buy Now?Which real estate technology platform to buy?
$ZG Zillow Group, $OPEN Opendoor Technologies, $EXPI eXp World Holdings or $RDFN Redfin Corporation
There is no doubt all of the above-mentioned companies are good ones and they will do well in the long term, but at this particular time, the confluence of the technical analysis signals and valuation analysis shows that $ZG is a better choice if it breaks above and closes on a high volume. The setup still will be valid and must be revised if the price of $ZG slips down more, but sooner or later the breakout should trigger a very safe entry.
Interestingly, even though $ZG is the largest of all four, it has a higher gross margin and its revenue growth (50%) is smaller than $OPEN (81%) only for 2022. However, $ZG has the smallest EV/GP ratio for both 2021 and 2022 at 10.1 and 8.2 respectively. This makes $ZG a very good deal for the size and reputation it has as well as for the growth it is developing. $OPEN still remains a company that has the highest growth rate, but since it just IPOed last year and except the last QE the negative pressure on the price was a lot since it was a SPAC deal. The pressure on the SPAC stocks was brutal and some of them barely survived above 10. $OPEN is one of them that was picked up by the market as a worthy stock and not a bad SPAC rip-off deal. Unlike Zillow that has gained reputation and maturity in the public market, $OPEN needs more time and more QEs to justify the high growth rates.
Disclaimer: I own a lot of $OPEN and some $EXPI and I am going to initiate a new position on $ZG in the near future. This is not trading or investment advice. Do your own due diligence. Don't risk money you cannot lose.

Z for Grouth?Write all questions and not accuracy in the comments.
1. Until July 2018, we developed the 1st wave
2. Further, until 2020, we developed a correction, I adhere to this form. Since the orange abc is the Expended flat, B= 1.382 A, C=2 of the A wave, when using Trend based, L1=L2. WXY is usually threes. In wave X, there is not quite a triple, but I will close my eyes, you can replace it with ABC, in the composition of C there will be ABC, which I described earlier. THIS IS THE second
3. Next, we have alternatives. We could have developed all this time the 1st as part of a large third – (1) blue or it was the 3rd-alt III red.
4. The depth of correction? Since it is possible to distinguish clearly 9 waves in the growth from the beginning of 2020 to the beginning of 2021, it seems difficult to determine the stretched 5th wave or the 3rd. Therefore, there is a yellow alt numbering.
5. The current correction is ABC, the depth of the wave (c) can be as 1 of the wave (a), also 0.382 of the correction from the entire movement. So is 1.618 from the wave (a), also 0.5 corrections from the entire movement during the year. I.e., this is an 85 or 60 landmark. As a result, this is a certain area of the correction goal, where the price can reach the bottom, in the considered model – $ 85-60.
6. If the bottom is reached at the level of $ 86. You can take it with readiness for further decline, and wait for the price of 100, as a level from which we can start, as some kind of confirmation of the price reversal, there will also be moving averages + a round price at this level.
7. There are green levels of 0.382; 0.5; 0.618 on the chart – these are the values for the option if this entire correction was only part of the 1st part of a large flat correction. But even in this case, at least 25% growth. A flat long consolidation can occur if the company's revenue growth slows down (it is now reaching profitability, by the way) and will show a small constant profit in the area of a specific value without significant growth. This can happen, just in the case of degenerative changes in the real estate market. This option will perfectly coincide with the FA and will reflect reality.
8. Globally, we can expect an update of the highs of $ 210 and above, up to$300. But this is not one year of movement.

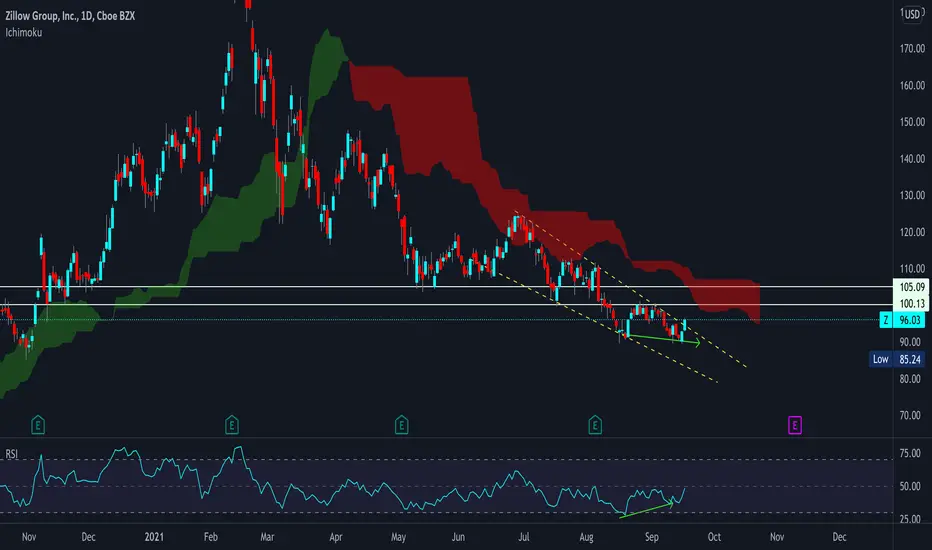
Z/ZG longZ broke out of downward wedge on daily time frames. Bullish divergence in play with upcoming resistance knocking in the 100-105 range. Setting stop loss below previous low
$Z Shows a Familiar PatternAs with so many growth stocks that were pumped to the gills last year and then subsequently destroyed this year, $Z has the familiar falling wedge displaying itself in so many places.
I expect it to break out soon and a conservative first target is noted.

$Z Long Zillow is down 50% from ATH, just had a solid earnings beat and got a strong reaction upwards when it retested below $90. Huge RSI divergence on the daily.
Looking at shares w/ a stop loss of 90, first PT of 101, rest are fibs.
Jan 2022 100-105c look good as well ($6-8)

The Future of Real EstateThe future of real estate (RE) is without a doubt online. As an agent in various cities across Texas (Houston + Bryan + College-Station), I have had real-world experience with how these factors affect the whole supply chain of RE. I believe that almost every aspect of RE is in the crosshairs of drastic change. I will break it down into several categories and a corresponding public company with ventures in the sub-sector.
Real Estate Tours - It is obvious why this practice was revolutionized during the COVID-19 pandemic. However, I believe that this trend will be one that sticks with us for the rest of time. The savings created in terms of time, travel, and other resources provides an immediate economic surplus. This is particularly true if you are moving from another state or country. Additionally, the universality of smartphones allows you to tour pretty much any property from the luxury of essentials anywhere.
STOCK: $RDFN - Redfin Corporation
Digital Document Signing - This should be the 8th wonder of the world. The ability to sign from anywhere is a luxury that the human race desperately needed. It enhances accessibility, speed of transaction, and paper reduction. Which all happen to be good for the environment. It’s a yes from me, dawg!
STOCK: $DOCU DocuSign Inc.
Photography/Staging - One of the newest development in RE is immersive virtual tours and virtual staging. Check one I made here (Use incognito Browser). Both are huge developments with serious cost savings and arguably better results. Virtual tours are perfect examples of ‘a picture is worth 1000 words’. Staging is a huge development because it takes the hassle and money out of physically moving furniture, decor, etc into AND out of an unoccupied home. A huge benefit for all parties.
STOCK: $MTTR - Matterport
House Pricing - Pricing a home is one of the hardest things for a realtor. There are a lot of variables that you must take into account and the margin of error can be quite significant. So, why not use technology which is infinitely better at math than the greatest mathematician? Pricing mechanisms like Zillow’s Zestimate use AI and variables about a home to instantly price any property.
STOCK: $Z - Zillow Group Inc.
Wholesaling - One of the most profitable industries in RE is wholesaling. What is wholesaling? Just like any wholesaler, they buy products at a discount and then sell them at a larger markup. Think Walmart or Amazon but for all kinds of RE. These entities find distressed or unwanted properties and find a corresponding buyer for a premium. Economically speaking, anytime you take out the middleman more profit is shared between the counterparties, the same applies in this scenario.
STOCK: $OPEN - Open Door Technologies
Property Management - Property management is exactly what it sounds like, boring right? The management of property whether that property is a 1-bed house or a 1000-unit apartment property management companies manage these properties. They are in charge of getting the property leased, performing maintenance, settling customer services disputes, and everything in between. Yet, for the most part, property managers are antiquated and use little technology. With AI and automation, we are on the verge of a management revolution.
STOCK: I am unaware of a good company in the space. Any suggestions?
In summation, each of the categories is distinct in its own way and each of these categories is vital for the RE complex as a whole. As the industry continues to evolve these processes will still be required in the business. The manner in which the business is conducted, however, is positioned to be disrupted in a massive way. We are in a RE renaissance.

ZTrade alert. Breaking 101.69 should
Be a pretty clear run to 112$. Has been in downtrend but this ascending triangle built here is giving Us a clear higher low trend.
Great trade let’s see if we can break. Can also enter above 102 for safer entry
my buy alerts are set

Zillow to move to next Fib levelZillow consolidating for long, looks like shaked all sellers - possible move up to next Fib level or 136$
