Z eyes on $68.80-69.75: Resistance even the Fib-Blind can SEEZillow has bounced into a major landmark of its lifetime.
Zone is defined by a Golden Covid and a Minor Genesis fib.
This has been tested from both sides many times already.
$ 68.60-69.75 is the exact resistance to watch.
$ 61.82-62.50 is the first support below to hold.
$ 76.18-7./00 is a good first Target for longs.
===================================================
.
ZG trade ideas

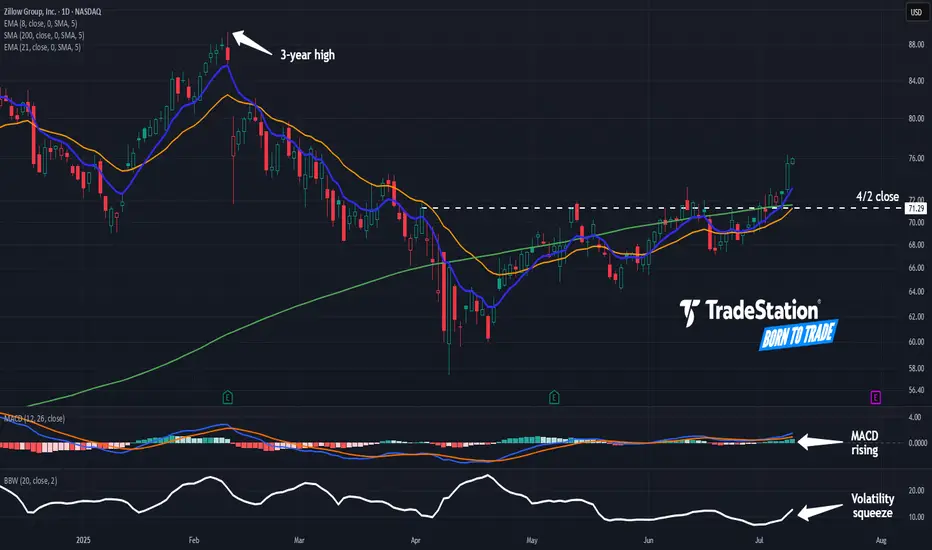
Zillow May Be Coming to LifeZillow has been in a tight range for months, but now it may be coming to life.
The first pattern on today’s chart is the April 2 close of $71.29. Z closed above it last week and is extending the move, which may confirm a breakout.
Second, prices pushed above the rising 200-day simple moving average. That may reflect a bullish long-term trend in the housing tech stock.
Third, the 8-day exponential moving average (EMA) is above the 21-day EMA. MACD is also rising. Those signals may be consistent with short-term bullishness.
Finally, Bollinger Band Width hit a two-year low last week. Could that price compression give rise to expansion?
Check out TradingView's The Leap competition sponsored by TradeStation.
TradeStation has, for decades, advanced the trading industry, providing access to stocks, options and futures. If you're born to trade, we could be for you. See our Overview for more.
Past performance, whether actual or indicated by historical tests of strategies, is no guarantee of future performance or success. There is a possibility that you may sustain a loss equal to or greater than your entire investment regardless of which asset class you trade (equities, options or futures); therefore, you should not invest or risk money that you cannot afford to lose. Online trading is not suitable for all investors. View the document titled Characteristics and Risks of Standardized Options at www.TradeStation.com . Before trading any asset class, customers must read the relevant risk disclosure statements on www.TradeStation.com . System access and trade placement and execution may be delayed or fail due to market volatility and volume, quote delays, system and software errors, Internet traffic, outages and other factors.
Securities and futures trading is offered to self-directed customers by TradeStation Securities, Inc., a broker-dealer registered with the Securities and Exchange Commission and a futures commission merchant licensed with the Commodity Futures Trading Commission). TradeStation Securities is a member of the Financial Industry Regulatory Authority, the National Futures Association, and a number of exchanges.
Options trading is not suitable for all investors. Your TradeStation Securities’ account application to trade options will be considered and approved or disapproved based on all relevant factors, including your trading experience. See www.TradeStation.com . Visit www.TradeStation.com for full details on the costs and fees associated with options.
Margin trading involves risks, and it is important that you fully understand those risks before trading on margin. The Margin Disclosure Statement outlines many of those risks, including that you can lose more funds than you deposit in your margin account; your brokerage firm can force the sale of securities in your account; your brokerage firm can sell your securities without contacting you; and you are not entitled to an extension of time on a margin call. Review the Margin Disclosure Statement at www.TradeStation.com .
TradeStation Securities, Inc. and TradeStation Technologies, Inc. are each wholly owned subsidiaries of TradeStation Group, Inc., both operating, and providing products and services, under the TradeStation brand and trademark. When applying for, or purchasing, accounts, subscriptions, products and services, it is important that you know which company you will be dealing with. Visit www.TradeStation.com for further important information explaining what this means.
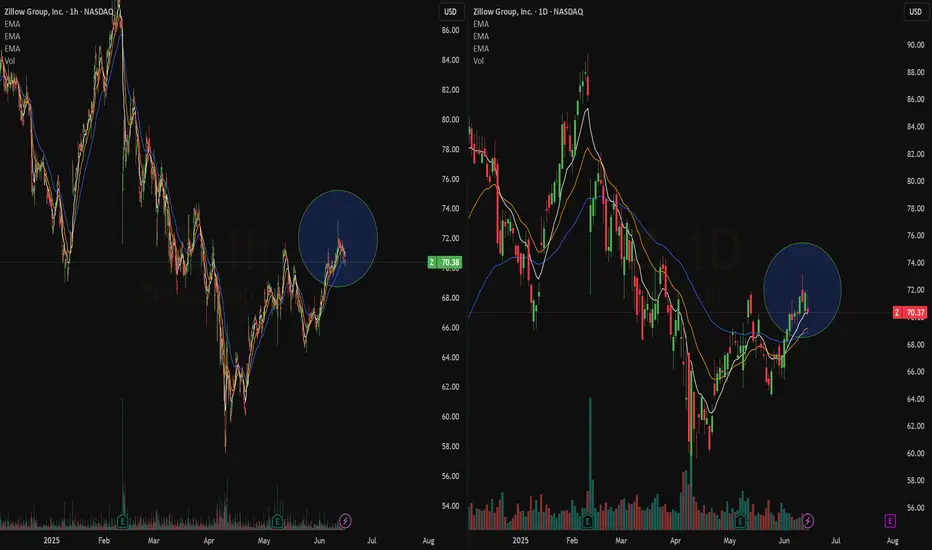
Quick View: $Z- Bullish Crossover on the daily chart, Bullish wave on the hourly chart.
- Some more volume would be good to support a new action to create new highs
What are your thoughts about my Zillow Analysis?I do believe Zillow will touch $98.04 then either push through, consolidate, or reverse. What are your thoughts?

2/11/25 - $z - I don't get it2/11/25 :: VROCKSTAR :: NASDAQ:Z
I don't get it
- 2.5% fcf yield "let's see"
- google search trends keep seeing lower highs, lower lows (trends.google.com)
- it's not like rates are going down... so there's some obvious friction in the system
- and really... 35x 2026 PE for this?
- i applaud the home buying silliness (1P) the co did a few years ago, but frankly, as much as i use this platform to putz around, the interface/ UX just sucks Harry Bolz (@elonmusk)
- this feels like a rent-seeking slow bleed waiting to be disrupted situation facing an awkward home buying backdrop and where the stock has run and portfolio managers (if that's what they still call themselves) are just eating tiny triangle sandwiches and giving each other feel-good reach arounds about their respective books.
- unclear if i'm going to short this (bc shorting still sucks until we get a "pin" on the mkt), but i'm sure as hell not going to chase you all off the cliff. i'd say risk to the upside is maybe 5-10%... downside 10-20%.
- i've only owned this thing in the past (much lower), but at this pt, nothing's changed but the multiple has gone higher and the fundamentals have worsened. u draw your own conclusions. i'm just here to share my thoughts with me, myself and irene (hi baby!)
V

Z tags $85, pulls back to $75MODs have suggested that I provide more detail about the picks I make.
Sorry. I'm not as verbose as y'all, and I don't like things to be complicated.
My trading plan is very simple.
I buy or sell at top & bottom of parallel channels.
I confirm when price hits Fibonacci levels.
So...
Here's why I'm picking this symbol to do the thing.
Price at or near top of channels (period 100 52 39 & 26)
Stochastic Momentum Index (SMI) at overbought level
VBSM is spiked positive
Price at or near Fibonacci level
Buying a put if price reaches $85
Target is $75 or channel bottom
Stop loss is TBD

New Setup: ZZ : I have a swing trade setup signal. I'm looking to enter long if the stock can manage to CLOSE above the last candle high(BUY). If triggered, I will then place a stop-loss below (SL) and a price target above it(TP-50%,move SL to breakeven), then using the close below the 10SMA as my trailing stop loss. **Note: The above setups will remain valid until the stock CLOSES BELOW my set stop-loss level(3).

Zillow Group, Inc. (Z) AnalysisCompany Overview:
Zillow Group, Inc. NASDAQ:Z is a leading online real estate marketplace, transforming the real estate industry through innovative technology and strategic partnerships. Its platform serves as a bridge between high-intent homebuyers/renters and top-performing agents, fostering an ecosystem that drives revenue growth and enhances user satisfaction.
Key Drivers of Growth:
Agent Connections Strategy:
Zillow’s approach of connecting motivated buyers and renters with experienced agents generates immediate revenue through lead generation while cultivating a loyal user base, contributing to a self-sustaining growth flywheel.
Outpacing Industry Growth:
Analysts forecast 12% annual revenue growth for Zillow over the next three years, surpassing the 11% sector average. This positions the company to deliver superior stock performance amidst a competitive market.
Real Estate Tech Innovation:
Under the leadership of CEO Jeremy Wacksman, Zillow focuses on developing cutting-edge tools that streamline real estate transactions, such as advanced AI-driven property valuations and user-friendly interfaces. These innovations solidify its role as a leader in real estate technology.
Market Potential:
Zillow benefits from the increasing adoption of digital real estate solutions, supported by consumer demand for convenience and efficiency in property searches, transactions, and rentals.
Investment Outlook:
Bullish Stance: We are bullish on Z above $63.00-$64.00, given its strategic growth initiatives, sector-leading revenue projections, and technological advancements.
Upside Target: With its strong positioning, we target $105.00-$110.00, reflecting Zillow’s potential to capitalize on a growing market and its tech-driven competitive edge.
📈 Zillow—Innovating the Real Estate Landscape! #PropTech #RealEstateInnovation #ZillowGroup

Z pullback to $65MODs have suggested that I provide more detail about the picks I make.
Sorry. I'm not as verbose as y'all, and I don't like things to be complicated.
My trading plan is very simple.
I buy or sell at top & bottom of parallel channels.
I confirm when price hits Fibonacci levels.
Bonus if a TTM Squeeze in in play.
I hold until target is reached or end of year, when I can book a loss.
So...
Here's why I'm picking this symbol to do the thing.
Price above all channels (period 100 52 39 & 26)
Stochastic Momentum Index (SMI) at overbought level
VBSM spiked positive
Price at 3.618 Fibonacci level
In at $72
Target is $65 or channel bottom
Stop loss is $74


Looking bullish on Z!🔉Sound on!🔉
Thank you as always for watching my videos. I hope that you learned something very educational! Please feel free to like, share, and comment on this post. Remember only risk what you are willing to lose. Trading is very risky but it can change your life!

Zillow Group getting ready for 2x moveZillow is breaking out on monthly and weekly with decent volumes, getting ready for 2x move in first run and then we can will see for further targets.
A weekly close below 56 will negate this and we will have to revisit this again.

Z Zillow Group Options Ahead of EarningsAnalyzing the options chain and the chart patterns of Z Zillow Group prior to the earnings report this week,
I would consider purchasing the 47.50usd strike price Calls with
an expiration date of 2024-6-21,
for a premium of approximately $2.15.
If these options prove to be profitable prior to the earnings release, I would sell at least half of them.

ZILLOW, WILLOW WHEREOW THE PRICE GO? imma be honest, I'm running out of creative titles, so you get what you get.
Trends labeled
Price targets labeled.
really neat setup on zillow here.
These buy zones are marked at some major support, we have a short term trend leading to a top, and may have already hit. We have a long term support trend going in the bearish price direction.
All of the above can help determine potential price movements.
With RSI being overextended, the market as a whole, there is potential for quick downside right past support trend, into the zones of major price support, which will then create even stronger support, which will allow the price to keep climbing back up.
I'm hesitant to predict anything before seeing where it heads into earnings (13th labeled)
BUT..
IDK, something like this maybe?
Essentially, I don't know how it will look, or how steep it goes, but it's good to be prepared for some potential scenarios. This chart can cover quite a few of them if you're patient and wait for the right trade.
Overall, I would suggest being careful, and should the price go up before going down, it might be a better option to look for a short entry and ride the price down than jumping into a long position, especially with how this chart looks.

$Z PT $85Based on the linear regression channel, Zillow is primed to see $70+ by the beginning of June, and over $80 around the beginning of October.
Elliot wave is currently at the end of phase 2, beginning of phase 3, which is usually the largest move of the cycle.
Any entry right now seems good. Current price is $47.39 in pre-market. With PT at $85, that's a projected 44% gain.
Note: This is just my interpretation of the chart and not financial advice.


Big change FridayDoes this gut-punch to the RE tech industry signal a looming share price drop for BLK? An index of Z+OPEN+RDFN+HOUS has had a very high positive correlation to BLK--until now when the index took a hit from the NAR settlement.

Z - setting up H&S Formation once tests low $60skeep an eye on very nice short set up in Z.
Is housing gonna make a sharp turn with mortgage rates holding 7%+ level.
I say so.
The information and publications are not meant to be, and do not constitute, financial, investment, trading, or other types of advice or recommendations.

Like the Look of ZIllow here Zillow is looking to reclaim its former glory here
looking at the daily chart you can see a nice spring and back test.
the longer this name hold above 50 the more likely it could test the 66 resistance range that its had trouble with before.
will be keeping an eye on this as earnings approach in less than one month

$Z - Can this play out?NASDAQ:Z looks like short seller "Spruce Point" @sprucepointcap will not be sleeping well for a while.
Zillow could explode to $80, if cup and handle breakout occurs.

Zillow Group, Inc - bullish divergenceOn the above 2-week chart price action has corrected over 80% since the sell signal last February. A number of reasons now exist to be bullish, a few of which are:
1) A buy signal prints.
2) Regular bullish divergence. Currently 10 oscillators are printing divergence on the weekly chart (below).
3) Support and resistance. The yearly chart (bottom - each candle = 1 year of data) is showing price action testing support on past resistance from 2017 through to 2019 @ $40. It is very likely to act as strong support.
Is it possible price action falls further? For sure.
Is it probable? Highly unlikely.
Ww
Weekly chart with bullish divergence
Annual chart - support

All set to double your moneysLooks bullish and can retest 100 levels. Have your SL at 44. It an test 44 range before its leg up towards 100-105. All the best.

