ZKIN: Uptrend Continuation Patterns🐂🔥As we can see $ZKIN is reaching our targets in a perfect way. From the price movement now we can see an established trend. The reason is that the price keeps creating "continuation bullish patterns" with clear HH , HL.
Watch the previous analysis and you will see the trading performance for this stock.
Thank you and Good Luck!
ZKIN trade ideas

ZK INTERNATIONAL (ShortTerm Consolidation?)💎Technical Analysis Summary💎
NASDAQ: ZKIN
-ZK is rejected near 5 dollars psychological resistance level
-The good news though is the price is trading at the resistance area
-That is a sign of strength in terms of price action
-Because the Buyers are still interested in this level
-The 9MA support is our short term guide
-We have 4 hours left before this candle closes
-It is like ZK will consolidate around 4.4 dollars for the next few days
-We just have to keep the price above 4 dollars to keep the strong momentum
-So far, there is no major red today, only some profit-taking action
-This is a good opportunity to look for additional entries if there is a new strength
-I will share my new analysis next week
⚠️Please always read the description⚠️
A big Thanks for donating 💰 via Tradingview coins this week to TheDeFiPool 🙏🎉
``````````````````````````````````````````````
Trading Involves High Risk ⚠️
Not Financial Advice 💸
Please Exercise Risk Management 💱
``````````````````````````````````````````````
Thank You All!🙏😊💖For Supporting My Channel 📺
Through Leaving A Thumbs Up, Comment & Follow 💬
Happy Trading!😊💕💖
``````````````````````````````````````````````

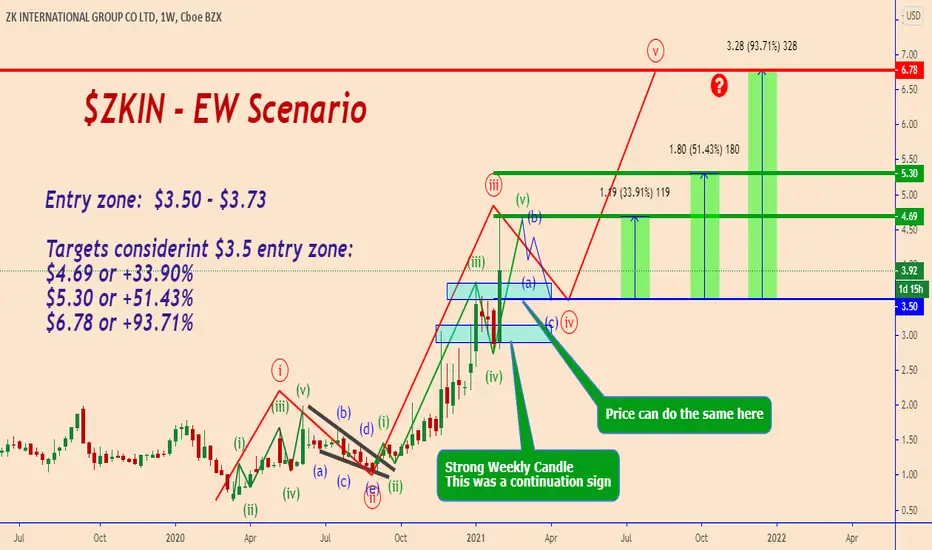
ZKIN:What To Expect After An Impulsive Move?After each impulsive move during the upward movement, we can see that this stock spent some time in consolidation. What we can observe is that the price likes to create a "bullish triangle" or "descending flag" before the next impulsive movement. As you can see also on the chart the price reacts very well to the support zones. The first and strong support zone may be found near $3.50 - $3.73. This is the zone where I will pay close attention for going long again.
Entry zone: $3.50 - $3.73
Targets considerint $3.5 entry zone:
$4.69 or +33.90%
$5.30 or +51.43%
$6.78 or +93.71%
Thank you and Good Luck!
Warning!
This is my personal trade and not a trading signal
We are here now:
The previous analysis on the last flag was fire + 67%:
Base analysis:

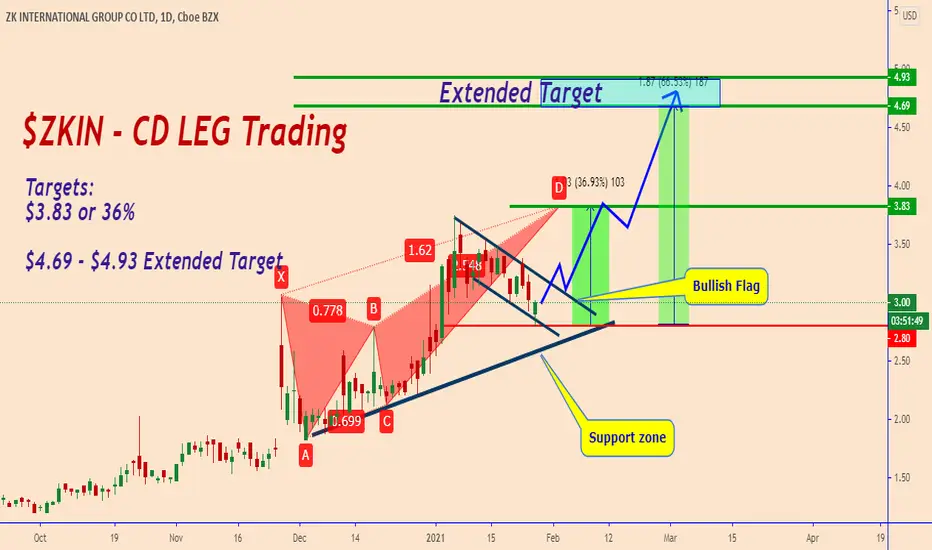
ZKIN: Just A Small Correction - Can We Buy Again?As I was expecting on my previous idea $ZKIN tested $2.87 - $3.00 USD price zone and now looks ready to move up again. This time I am going to follow the CD leg completion of the harmonic pattern for finding the profit-taking zone.
Targets:
$3.83 or 36%
$4.69 - $4.93 Extended Target
Thank you and Good Luck!
Bigger Picture:
Previous analysis:
ZKIN 1D Soon a new movement up (part 5)We continue the series of Zkin stock ideas as the inverted H&S global figure is very attractive and in action now.
It's been almost a month since the publication of our previous idea.
We will immediately spoil and brag, because the price has made another predicted movement now it is +60% , check :)
After 4 consecutive daily candles made false breakouts of the level $2.90, the price continued to move up evenly along the arrows drawn by us, for what we thank the market players.
Given that the previous weekly candle was closed by a powerful green pillar, this week we can expect not too deep correction, which we assumed in previous ideas.
How about making a correction to $3.90 and then start the next movement by +50%?)
Let's check the effectiveness of this forecast soon)

ZKIN: Bullish PennantBullish Pennant
Pros:
Descending volume during formation
PPS above 50MA and 200MA
RS above 0, but descending
ATR Ascending
R/R ratio above 4
200MA ascending
250RSI above 50
PT = 6.40$

Be aware of pumpers..!
My dear followers stay away from this ticker symbol..!
Scammers and pumpers are active in it..!
Today someone text me in TradingView for collaboration and publishing analysis.
I asked him to direct message me in telegram.
When he talked about publishing analysis for them , I asked about their criteria and what sort of analysis they are looking for???
Long story short, he said : “ You did not get it, we pick the symbol and you publish the bullish view on your page”.
For those of you who are new in this market, This is called stock pumping..!
Who are the stock pumpers?
Pump-and-dump is a scheme that attempts to boost the price of a stock through recommendations based on false, misleading or greatly exaggerated statements. ... Then, once the price of the stock has been increased sufficiently by unsuspecting marks, the promoters then sell the stock at high prices.
Please be aware of these conman jobs..!
I don’t expose them by name this time, but this is the last time!
These idiots don’t even bother to think that if I was a pumper I did not publish a 25 stocks weekly portfolios !
Please share this with your friends to teach them a lesson they don’t forget for the rest of their worthless lives..!
I am willing to trade any asset class, but the trust of my followers..!(Moshkelgosha)

ZKIN (LONG): Aiming for $6.00Price for ZKIN has made a really nice move
from the previous call,
anticipating the breakout from the bullish flag.
Currently, it has reached my TP1 @ $4.00.
For now I will be looking for a pullback to form
a bullish continuation for the cheap share.
Next TP is @ $6.00

ZKIN about to hit my 300% target!As you may notice, I've posted several Stock post about this unknown NASDAQ company based in China, ZKIN.
For a bit of fundamentals, checkout my first idea where the price was located at $2.00, 100% profit already!
As the price of ZKIN continues to be in a strong uptrend, breaking into new recent highs, a price of $6.00 per share would be nothing unusual to see! That would lead to another 50% increase from current price and a 300% increase from my first ZKIN outlook.
The weekly resistance levels are located at $4.70, $6.00 and $6.80.
So a break of $4.70 can easily result in a whopping 27% increase in few days.
But as the price of ZKIN likes to ride on 20 EMA, the price seems a bit overextended and a healthy correction to $3.30 area is also likely to be seen, where it may be a good idea to get into this stock! Buying dips is a good strategy in a strong uptrend, if you know where the dip will be located.
MACD after a strong selling wave gave a buy signal and buying volume keeps increasing.
RSI is above 60 which signifies that strong bullish momentum is present, a break below 60 will lead to a correction to $3.30 area.
So either buy a break of recent high at $4.67 or buy a dip at $3.30 area. If you are looking for the best risk reward and greedy, look to buy dips at 50 EMA at $2.70 per share where the price can also be headed in a strong correction.

ZK INTERNATIONAL (Retest Previous Top Resistance?)💎Technical Analysis Summary💎
NASDAQ: ZKIN
-After the Bullish breakout of trendline 2 days ago
-ZKIN created another Higher High confirmation of a strong push-up
-This is a 67% increase from its swing Higher Low at 2.8 dollars
-If we will see a retracement or pullback
-The potential local support would be around 3.7 dollars - 3.5 dollars
-This is also a confluence of previous resistance and Golden Fib zone
-Trading with the dominant trend is the best option right now
-Going Long and preparing your next trade plan is a must
-It would be an exciting trading opportunity again next week
-I will provide updates once a new structure is potentially in play
⚠️Please always read the description⚠️
A big Thanks for donating 💰 via Tradingview coins this week to Dinore 🙏🎉
``````````````````````````````````````````````
Trading Involves High Risk ⚠️
Not Financial Advice 💸
Please Exercise Risk Management 💱
``````````````````````````````````````````````
Thank You All!🙏😊💖For Supporting My Channel 📺
Through Leaving A Thumbs Up, Comment & Follow 💬
Happy Trading!😊💕💖
``````````````````````````````````````````````

ZKIN: Amazing Performance...Watching For Correction Again🔥On the previous analysis that I shared ZKIN did a great profit. The higher target was a +67% increase in the price. If you will check all of my analysis on this stock it showed us a wonderful performance and in my opinion, it hasn't finished yet. We just need to know how to follow this stock and how to take profits during the upward movement. For the time being, I am considering that the price compiled the 3-rd wave because of the aggressive move made this week. A strong resistance zone may be found near $3.50 - $3.73. This is the zone where I will pay close attention for going long again.
Entry zone: $3.50 - $3.73
Targets considerint $3.5 entry zone:
$4.69 or +33.90%
$5.30 or +51.43%
$6.78 or +93.71%
Thank you and Good Luck!
Warning!
This is my personal trade and not a trading signal
The previous analysis was fire +67%
Elliot Wave Analysis:
Base analysis:
ZKIN: Is ZKIN Still a Good Stock?As we have noticed before ZKIN has a very good performance. Its volatility as a stock makes it very profitable. In the current situation, we can notice a strong 4-day support area inside a descending channel. If the price will retest it again we can buy close to the price of $ 2.82 and we can take the profits according to the following targets.
Targets:
$3.16 or 12.32%
$3.83 or 36.21%
$4.69 or 67%
Previous analysis:
Bigger Picture:

NASDAQ 42% profit opportunity. The price of ZKIN is currently in a Bull flag, that is a bullish continuation pattern with bias to break to the upside. Alternatively we can draw this pattern as a falling wedge, but it’s a bullish pattern with bias to break to the upside.
This bull flag is expected to push the price at least to $4.00 per share, shortly followed by $4.30.
$4.30 will likely be a top based on weekly chart from where a moderate correction will be seen before any more upside.
The overall daily trend remains in strong bull trend as the price of ZKIN is above 20 EMA, a break below 20 EMA will lead to extended losses that can potentially reach $2.60 and deny this bull flag pattern. There are no technical signs why ZKIN should break below 20 EMA.
A break above $3.50 is likely to lead to extended gains all the way to $4.00 per ZKIN share!
MACD is on a corrective wave, as the price was too far away from 20 EMA. Notice how much are two EMA’s apart from each other, corrections such as this helps to reduce the potential losses.
RSI is in overall uptrend, in a trend of higher lows for a long period of time.
The overall daily outlook remains bullish as the price of ZKIN is in a daily bullish pattern, and the price can possibly this week reach a $4.00 mark per share!
Targets are located at $4.00 (37% profit) and $4.30 (47%), resulting in overall profit of 42%. (50/50)

ZK INTERNATIONAL (Bullish Trendline Break)💎Technical Analysis Summary💎
NASDAQ: ZKIN
-After multiple Bullish rejections at new support around 2.8 dollars
-Finally, a strong Bullish candle broke above the trendline resistance
-What we need to see is more follow-through from the Bulls in the coming days
-We have two potential Bullish scenarios here to watch
-First is a retest of previous trendline resistance to become new support and continue higher
-Or we will see a strong upside recovery up to the recent top around 3.7 dollars
-Before we will see a minor consolidation before breaking to new Higher High
-Either of these two scenarios, we can safe to say that the Bulls are back
-And the mid-term uptrend priority is likely to continue
-I will give a new update before the end of this week
⚠️Please always read the description⚠️
A big Thanks for donating 💰 via Tradingview coins this week to ProjectSyndicate 🙏🎉
``````````````````````````````````````````````
Trading Involves High Risk ⚠️
Not Financial Advice 💸
Please Exercise Risk Management 💱
``````````````````````````````````````````````
Thank You All!🙏😊💖For Supporting My Channel 📺
Through Leaving A Thumbs Up, Comment & Follow 💬
Happy Trading!😊💕💖
``````````````````````````````````````````````

ZKIN (LONG): Get ready for more upside continuation!Price for ZKIN has made a nice breakout above
the level @$2.70.
For the past few weeks,
it has been consolidating in this falling wedge pattern.
Seems like the phase is almost done.
Looking for more upside soon!
Fundamental:
ZKIN is a company that manufactures and supplies patented high-performance stainless steel and carbon steel pipe products primarily used for water and gas supplies.
News has been released by the company that they are forming a joint venture with a real estate giant in China to bid for a Hydropower project worth an estimated 4.9 billion RMB.
This project will be funded by the Chinese government so once the bid is approved by the authorities, the price is gonna Soar!

ZK INTERNATIONAL (Key Support Found?)💎Technical Analysis Summary💎
NASDAQ: ZKIN
-The price respected the 0.5 Fib support level twice
-Today's candle is the confirmation of a new support area
-Currently, ZKIN is testing important resistance trendline
-This is the level that needs to break to continue its upward move
-If this resistance level can't be broken today
-Next week trading would be really interesting
-Because we will have a decision-making scenario
-Technically, the market is shifting from ranging to an uptrend
-Our trading bias or priority remains on the Bullish side
-If you are aggressively entering for Long position
-You should place a stop loss below 0.5 Fib
-But if you want a conservative entry point
-Waiting for the trendline resistance breakout is the next option
-Please always have a trading plan and execute them properly
-I will publish a new analysis once new data come into play
⚠️Please always read the description⚠️
A big Thanks for donating 💰 via Tradingview coins this week to CryptoConsultingServices 🙏🎉
``````````````````````````````````````````````
Trading Involves High Risk ⚠️
Not Financial Advice 💸
Please Exercise Risk Management 💱
``````````````````````````````````````````````
Thank You All!🙏😊💖For Supporting My Channel 📺
Through Leaving A Thumbs Up, Comment & Follow 💬
Happy Trading!😊💕💖
``````````````````````````````````````````````

ZKIN (LONG): Consolidate, support retest, more upside!Price for ZKIN has created a higher high,
and above the green Ichimoku Cloud.
This shows that it is in a strong uptrend.
It is currently consolidating in a falling wedge pattern.
Looking for it to test the support area and more upside from here!
Fundamental:
ZKIN is a company that manufactures and supplies patented high-performance stainless steel and carbon steel pipe products primarily used for water and gas supplies.
News has been released by the company that they are forming a joint venture with a real estate giant in China to bid for a Hydropower project worth an estimated 4.9 billion RMB.
This project will be funded by the Chinese government so once the bid is approved by the authorities, the price is gonna Soar!

ZK INTERNATIONAL (Daily 20MA Good Support?)💎Technical Analysis Summary💎
NASDAQ: ZKIN
-It seems the 3.7 dollar is a strong resistance zone
-The price was unable to break its previous High
-ZKIN has pulled back to its 20MA support area
-We still have a few hours left before this daily candle closes
-It seems to be the 3 Dollar zone is acting as a good support
-This is also a confluence of previous resistance last Nov 25, 2020
-All major moving averages are still below the price
-So basically, the trading priority is going Long
-If you are an aggressive buyer, you can start to scale in
-Just above the 3 dollar area provided there are signs of strength
-But if you want to be more cautious and wait for extra confirmation
-A breakout above the trendline resistance is your next option
-The upside target is the recent High around 3.7 dollars or higher
-For now, I'm expecting a potential consolidation in the next few days
-There is no major red flag yet provided the over-all market condition is in our favor
-Once the market saw new development, I will try to share my new analysis
⚠️Please always read the description⚠️
A big Thanks for donating 💰 via Tradingview coins this week to Dinore 🙏🎉
``````````````````````````````````````````````
Trading Involves High Risk ⚠️
Not Financial Advice 💸
Please Exercise Risk Management 💱
``````````````````````````````````````````````
Thank You All!🙏😊💖For Supporting My Channel 📺
Through Leaving A Thumbs Up, Comment & Follow 💬
Happy Trading!😊💕💖
``````````````````````````````````````````````

ZKIN: Ascending Triangle & RSI ChannelOn the 4 hour chart we can see that the price broke out of an ascending triangle and now a possible pullback up to $3.00 is expected for a retest of the broken support. So $2.87 - $3.00 USD is a price zone that I would pay close attention to.
From the other side we can see that RSI indicator is creating an Ascending Channel. All the time the indicators line reached the support line of the channel it changed direction and the price did the same as well. So we are anticipating the same move again. For more in-depth analysis check the related ideas.
Targets:
$4.08
$4.93
$6.78 exteded target
Thank you and Good Luck!

ZKIN in Triangle headed to $4.00 (20%)The price of ZKIN has formed a symmetrical triangle pattern, which can break both to downside or upside. Considering that the price of ZKIN is in a 4H uptrend, it’s more likely to break to the upside.
Basically as long as the price isn’t below 50 EMA, which is currently located at $3.12, the overall uptrend remains.
The downtrend line that ZKIN has to break, is currently located at $3.44. A break of $3.50 would then confirm the break of the downtrend line, and the gains could exceed to retest recent pivot high located at $3.79.
On the other hand, the uptrend line is located at $3.20 per share. If bulls wants a strong uptrend, the price has to maintains above 20 EMA. Currently ZKIN is above 20 EMA, so we may say that a we are in a strong 4H uptrend.
Indicators.
After two strong selling waves, MACD wave indicator can likely signal a buying wave, as it’s still above neutral bullish levels in uptrend. Above 0, (26EMA = 0.05, 9EMA = 0.08)
RSI is showing a normal hidden bullish divergence, which is expected to push the price higher or a see correction to the upside.
Current 4 hour resistance levels, which break of confirms bullish momentum.
$3.50 $3.75 $4.00!
Support levels.
$3.35 $3.10 $2.95
The 4H overall ZKIN outlook will confirm either a break above $3.50 or a break below $3.15. Both of these levels will bring momentum. Either to $4.00 or $2.95.

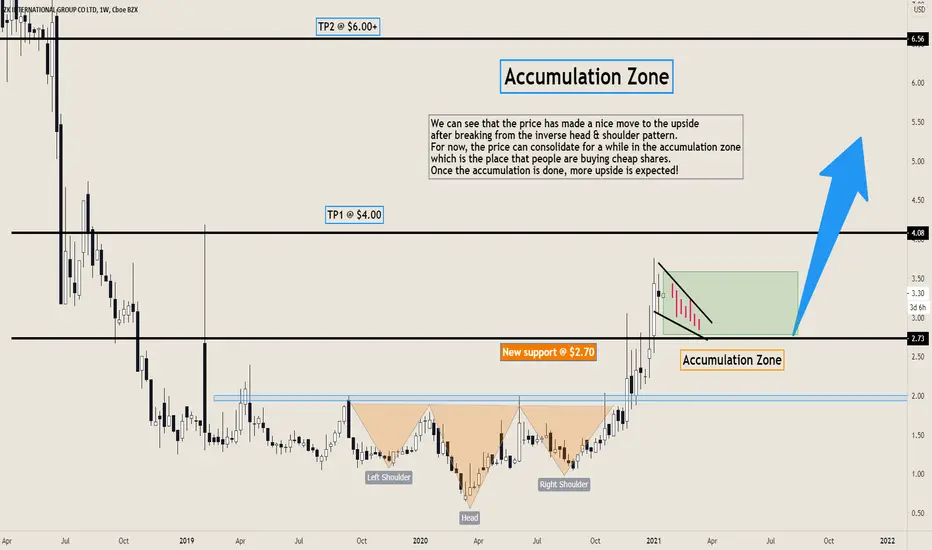
ZKIN (LONG): Breakout, accumulation and upside continuation!We can see that the price has made a nice move to the upside
after breaking from the inverse head & shoulder pattern.
For now, the price can consolidate for a while in the accumulation zone
which is the place that people are buying cheap shares.
Once the accumulation is done, more upside is expected!
Fundamental:
ZKIN is a company that manufactures and supplies patented high-performance stainless steel and carbon steel pipe products primarily used for water and gas supplies.
News has been released by the company that they are forming a joint venture with a real estate giant in China to bid for a Hydropower project worth an estimated 4.9 billion RMB.
This project will be funded by the Chinese government so once the bid is approved by the authorities, the price is gonna Soar!
ZKIN 1D Soon a new movement upWe continue the series of Zkin stock ideas as the inverted H&S global figure is very attractive and in action now.
It's been a month since the publication of our previous idea.
Whoever listened to our previous idea had a great chance to earn 50% on Zkin stock price move up .
Now the price is consolidating above the level of $3.20, so to speak, concreting it from above.
This price behavior can be seen as preparation for further upward movement.
We can assume that the next move up will again reach +45-50% to the level of $4.60.
However, do not forget about the stop , it is logical below 3.
If we look at the history of the stock price movement, we can see that in the zone of $3.20-4.60 before there was a certain consolidation, before further downward movement. Therefore, we doubt that now, for the first time the price will be able to move above $4.60.
We also recommend to look through our previous ideas of the Zkin stock. You will be able to read general information about ZK International Group Co., Ltd and understand our logic of stock analysis.

ZKIN: Advanced 🐂 Elliot Wave Scenarios⬆️($ZKIN) ZK International Group Co. on 10 December 20, signed a letter of intent with Tuopeng Industrial. Together they will form a joint venture that would bid on the construction of a navigation and hydropower project with a total estimated cost of approximately USD 0.7 Billion according to Nasdaq news.
Actually, $ZKIN is doing really great. Now I am focused on two possible scenarios related to Elliot Wave development.
Scenario 1: The price might be in the 5-th wave that can end near $4.08 - $4.54 and after that, a move higher is expected again up to $6.78
Scenario 2: We might be in the 3-rd wave extended wave that can end near $4.08 - $4.54 and the 5-th wave might end near $6.78.
Please don't forget to FOLLOW, LIKE, and COMMENT ...
If you like my analysis:)
Thank you and Good Luck!
First Analysis:
Second Analysis: Profits +27.63%
Third Analysis: Profits +21.92%
Forth Analysis: Profits +19.87%, +31.53%, +43.70%
Fifth analysis: 16.84%, 22.7%, 31.69%
Sixth analysis:
Seventh analysis:
Eight analysis:
