Natural Gas Price Hits 3-Month HighNatural Gas Price Hits 3-Month High
According to today's XNG/USD chart, the price of natural gas:
→ has risen by approximately 30% since the beginning of September;
→ is currently around the 2.95 level – the last time the price was at this level was at the end of June this year.
Bullish sentiment is supported by:
→ forecasts of a warmer autumn, which is increasing demand for natural gas to power air conditioning systems;
→ concerns related to Hurricane Helen in the US Gulf of Mexico. According to the EIA, 5% of total US dry natural gas production comes from the Gulf of Mexico, and 51% of the total capacity of US natural gas processing plants is located along the US Gulf Coast.
Technical analysis of the XNG/USD chart shows that in September, the price has been moving within an ascending channel (marked in blue).
It is noticeable that from the 20th onwards, demand forces have intensified, leading to the following:
→ the price broke through the 2.64 resistance level;
→ the price moved to the upper half of the ascending channel, after which its median line began to show signs of support;
→ the RSI indicator reached overbought territory.
Currently, there are no signs on the XNG/USD chart of bears attempting to seize control, while the bulls may be "gathering strength" for a possible attempt to break through the psychological level of 3.00. If this happens and is successful, it could pave the way towards the yearly high in the 3.20 region.
This article represents the opinion of the Companies operating under the FXOpen brand only. It is not to be construed as an offer, solicitation, or recommendation with respect to products and services provided by the Companies operating under the FXOpen brand, nor is it to be considered financial advice.
NATURALGAS trade ideas

Natural Gas (NG/USD) Analysis - Harmonic Pattern at Key LevelsNatural Gas (NG/USD) is currently showing a Bullish Gartley harmonic pattern, with price hovering near a crucial resistance at 2.9000 USD. Fibonacci retracement levels highlight key zones for support and resistance.
The TDIGM indicator suggests overbought conditions, as the market has surged significantly over the past few sessions. This increases the possibility of a short-term correction or sideways movement before another bullish leg.
Investment Strategies:
1.Short-Term Sell (Reversal Strategy):
Rationale: The price has reached a critical harmonic point (D) and is showing signs of resistance near the 2.9000 USD level, with the TDIGM suggesting overbought conditions. This setup increases the likelihood of a corrective move.
Sell Entry: Around 2.8360 - 2.9000 USD after confirmation of price rejection at current levels.
Stop Loss: Above 3.0750 USD, in case of a bullish breakout beyond resistance.
Take Profit: First target at 2.7000 USD (0.236 Fibonacci retracement); Second target at 2.5781 USD (0.382 Fibonacci retracement).
Risk/Reward Ratio: This strategy offers low risk/reward ratio, despite the potential for a profitable correction in the short term.
2.Medium-Term Buy on Pullback:
Rationale: The price action suggests a longer-term bullish trend, despite the potential short-term correction. Entering after a pullback to key support levels provides a safer entry point for medium-term buyers.
Buy Entry: Around 2.5000 - 2.4787 USD, which corresponds to the 0.5 Fibonacci retracement level, offering a good entry after the expected correction.
Stop Loss: Below 2.3600 USD
Take Profit: First target at 2.8360 USD, retesting previous highs;
Second target at 3.0750 USD, following the next leg higher.
Risk/Reward Ratio: A well-timed pullback entry offers a low-risk, high-reward trade with the potential to capture the next wave up in the bullish trend.
3.Breakout Buy Strategy (Bullish Continuation)
Rationale: If the price breaks above the 3.0750 USD resistance level, it indicates a strong continuation of the bullish trend, opening up more upside potential.
Buy Entry: After a confirmed breakout and close above 3.0750 USD, which could trigger further upward momentum.
Risk/Reward Ratio: The breakout strategy can offers a strong potential reward if the price breaches the key resistance, leading to higher highs.
The Natural Gas market is approaching a pivotal point, with Point D of the harmonic pattern acting as a potential reversal zone. The short-term sell strategy offers a high-probability trade based on the current overbought conditions and harmonic setup, while the buy-on-pullback strategy provides a safer entry for longer-term bulls. If the price breaks out above the 3.0750 USD resistance, a continuation of the bullish trend is likely, offering further upside potential.
As always, monitor the price action closely, especially on lower timeframes for additional confirmation.

Natural Gas forming a perfect W pattern### Analysis of the W Pattern on the Natural Gas Chart
A **W pattern**, also known as a **double bottom**, is a bullish reversal pattern that typically indicates a shift from a downtrend to an uptrend. Here’s a detailed analysis of the current W pattern forming on the natural gas chart:
#### Key Characteristics of the W Pattern:
1. **Two Troughs**: The pattern consists of two distinct lows (troughs) at approximately the same price level, separated by a peak (intermediate high).
2. **Volume Confirmation**: Volume often increases at the second trough, indicating stronger buying interest.
3. **Breakout Point**: The pattern is confirmed when the price breaks above the intermediate high (the peak between the two troughs).
#### Current Natural Gas Chart Analysis:
1. **Formation of Troughs**:
- The first trough formed at around $2.20/MMBtu, where the price found initial support.
- The second trough formed at a similar level, reinforcing the support zone and indicating a potential double bottom.
2. **Intermediate High**:
- The peak between the two troughs is around $2.50/MMBtu. This level acts as a resistance point that needs to be broken for the pattern to be confirmed.
3. **Volume Analysis**:
- There has been an increase in trading volume around the second trough, suggesting stronger buying interest and potential accumulation by traders.
4. **Breakout Confirmation**:
- For the W pattern to be confirmed, the price needs to break above the $2.50/MMBtu level with strong volume. This breakout would signal a bullish reversal and the potential for further upward movement.
#### Potential Price Targets:
1. **Initial Target**:
- The initial price target is typically the height of the pattern added to the breakout point. In this case, the height is approximately $0.30 (from $2.20 to $2.50), giving an initial target of around $2.80/MMBtu.
2. **Secondary Target**:
- If the bullish momentum continues, the next target could be around $3.00/MMBtu, a psychological resistance level and a previous support zone.
#### Risk Management:
- **Stop-Loss Placement**: A stop-loss can be placed just below the second trough (around $2.15/MMBtu) to manage risk in case the pattern fails.
- **Volume Monitoring**: Continuously monitor volume during the breakout. A breakout with low volume might indicate a false breakout.
### Conclusion:
The current W pattern on the natural gas chart suggests a potential bullish reversal. Traders should watch for a breakout above the $2.50/MMBtu level with strong volume to confirm the pattern. Proper risk management and volume analysis are crucial to capitalize on this potential trading opportunity.

Long trade
Tue 24th Sept 24
1.00 am
Toyko to LND Session
Pair NATGASUSD
4Hr TF Entry
Buyside trade idea
Entry 2.571
Profit level 2.815 (9.49%)
Stop level 2.553 (0.70%)
RR 13.56

NATGAS has consolidated will be over $4 before you know it NATGAS has consolidated. We will break the trend line and head over 4-6 range huge money to be made invest now .

Natural Gas Goes Kaboom!Profits have been secured I the Natural gas trade. That being said I still think Nat gas equities can push higher.
On the UNG chart we just saw the 20 day MA & 50 Day MA bullishly crossover each other.
Last time this happened Nat gas had a 4-5 day parabolic move.
The bulls must be careful to not push this commodity up too quickly because it makes the pattern less likely to have a continued breakout.
We are still putting in Lower weekly highs, so the next test of the most recent pivot high is going to be crucial.
If the bulls can trigger the weekly inverse head and shoulder pattern there's going to be a great long continuation opportunity. Until we break the pivot high & create a higher high traders must use caution now that we've had a large move occur.
AR, EQT, CPK, LNG are all set to push higher if Nat gas holds these gains.

Long trade Pair NATGASUSD
Thu 19th Sept 24
9.00 am
LND to NY Session Observed
Pair NATGASUSD
Buyside trade idea
Entry 2.214
Profit level 2.316 (4.61%)
Stop level 2.203 (0.50%)
RR 9.27

NAtural gas is breaking resistance leveI started a Buy position in NAT GAS/USD , with 2:1 ratio for swing trade, beacause it is a great positive bullish delta volume showing in volume indicator that I ploted in this study.

Weaker Dollar and Ai energy demand to Benefit Natural GasDespite potential weakening demand as seen in crude oil complex, nat gas seems to be getting uptick in demand at these low prices.
Falling rates weakening the dollar may benefit the international appeal of Liquid Natural Gas exports.
Rising AI infrastructure demand may provide steady and increasing demand for the cheapest source of energy, which is likely nat gas powered electricity.
Be aware of tricky futures products that increase cost to trade. UNG and BOIL have inefficiencies in them due to compounding and future rollover costs. Selling puts and put spreads might be a relatively conservative way to benefit from upside in nat gas.

NATGAS Long !Based on Quarterly volume profile and Price Action on Daily Timeframe suggests a long trade to $2.5 🚀

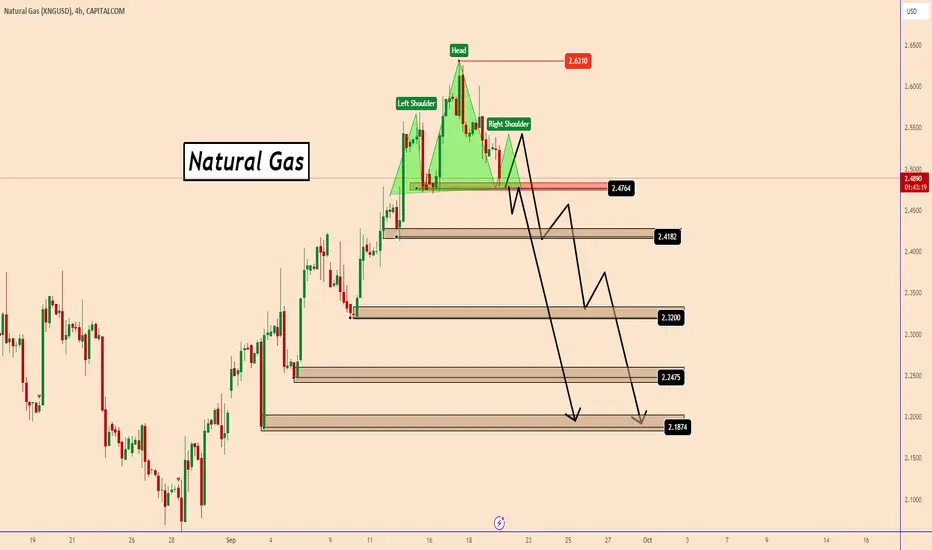
Natural Gas Likely Reached the Peak at 2631Natural Gas Likely Reached the Peak at 2631
Natural Gas is about to form a Head and Shoulders pattern. The price is approaching the neckline zone, and a small correction for the right shoulder of the pattern is expected. If this occurs, the odds are higher that Natural Gas will move down.
If Natural Gas moves below the neckline of the anticipated pattern, it may develop into another bearish pattern.
You can find more details on the chart.
Thank you :)
Long trade
Trade Setup:
Entry Price: 2.232
Profit Level: 2.632 (17.92% gain)
Stop Loss Level: 2.156 (3.47% risk)
Risk-Reward Ratio (RR): 5.26
The setup is supported by fundamental factors like seasonal demand for natural gas, and potential supply constraints. Price level 2.232 represents a support level and the profit target of 2.632 is (17.92% gain) aiming for a key resistance level.

AUD/JPY Short, AUD/NZD Short and NATGAS/USD ShortAUD/JPY Short
Minimum entry requirements:
• Tap into area of value.
• 1H impulse down below area of value.
• If tight 5 min continuation follows, reduced risk entry on the break of it.
• If tight 15 min continuation follows, 5 min risk entry within it, or reduced risk entry on the break of it.
AUD/NZD Short
Minimum entry requirements:
• Break above area of value.
• 1H impulse down below area of interest.
• If tight 5 min continuation follows, reduced risk entry on the break of it.
• If tight 15 min continuation follows, 5 min risk entry within it, or reduced risk entry on the break of it.
NATGAS/USD Short
Minimum entry requirements:
• Tap into area of value.
• 1H impulse down below area of interest.
• If tight 5 min continuation follows, reduced risk entry on the break of it.
• If tight 15 min continuation follows, 5 min risk entry within it, or reduced risk entry on the break of it.

Natural Gas down to 2.3200 before up to 3.1350 IDEASo this is how is see Natural Gas price to react in the upcoming days and weeks.
The price is moving according to 12345 Elliott Impulse Wave, so it will now go down to touch the 4th impulse at around 2.3200 support area. It will then move rapidly up to complete the impulse wave 5 and reach support area at around 3.1350.
It had a strong upside movement last week, now it would be a time for a correction. Plus this arc shape fits well here.
What do you think?

NATGAS - Perfect double bottom - Price in Rising Channel.On the daily chart, NATGAS has formed a perfect double bottom, it's above the Daily 20, 50 and 100 EMAs. We are now contending with the 200ema.
Price on the 1 hour is in a rising channel.
Daily RSI and 1 Hour RSI above the 50 line, which is a bullish turning signal.
Seasonality and reduce production is on the bulls side.
Production hovering at 99.8bcf per day.
October contract rolls over to November soon.
La Nina is 80% chance for 2024/ 2025 winter, which should bring a stronger winter compared to the last 4 years.

Natural Gas: Weak Day / Strong WeekNatural gas had a bit of profit taking today and you can't blame the bulls for trimming especially since we did the same.
The Daily chart now needs a couple days of consolidation before another sustainable push.
The weekly chart recaptured the 50 Weekly MA...very good near term sign.
This can now be used as a support level to trade against for very tight stoploss swing traders.
As long as we remain above the breakout neckline we should be likely heading to retest 2.75 & $2.90
Levels below can cause nat gas to fail and fall substantially. Alway remembers the Weekly trend still has Lower highs in place.

NATGASU 12HIn a downtrend, a double bottom pattern has formed. Wait for the neckline breakout, and after receiving the necessary confirmations, you can achieve a good profit.

Natural Gas turning bullish? Natural gas has now cleared a major resistance zone and is looking poised to head higher.
We have a beautiful daily and potential weekly inverse head and shoulder pattern developing.
The micro daily chart bullish pattern has triggered and gives us another +8-10% of upside.
However the really juicy pattern is the potential weekly chart set up.
If we breakout of the $2.90-$3 range we have a massive potential move to the upside brewing.

Natural Gas continues to be green No change in the long idea in Natural Gas. Moving stops into trailing mode to lock in the profits.

Natural Gas / Bullish Up MovementLooks like Natural Gas forming a Head and Shoulders pattern on daily frame. There's a high probability the price go higher to 1st TP 2.50 and 2d TP 2.73.
Please, share your comment!

NG Daily Forecast As per study today NG will Remain Down, Based on Fundamental and technical analysis.
Pl See the Chart for Short entry and Target!! !
All the best

Short Natgas to 2007There is a clear oversupply and weakened demand for Natgas and now the hurricane is reducing LNG distribution.2007 is the target as a low support on the daily and just above the big round number. Estimate to hit this week.

Natural Gas Daily ForecastIt Seem , NG Will Take Small Correctional before heading to Big Move, As Per Elliot Wave it can be corrected up to 50% of current trend i.e. 2.26 USD Range .
Divergence are also visible , to confirm protentional reversal from hear.
