Natural Gas King #2Hello Ladies and Gentlemen,
Natural Gas is approaching its lowest price since its inception!
Who knows who Arnold is?
NATURALGAS trade ideas

Natural Gas Robbery Plan To Make and take MoneyMy Dear Robbers / Traders,
This is our master plan to Heist Natural gas based on Thief Trading style Technical Analysis.. kindly please follow the plan I have mentioned in the chart focus on Short entry. Our target is Green Zone that is High risk Dangerous level, market is oversold / Consolidation / Trend Reversal at the level Bullish Robbers / Traders gain the strength. Be safe and be careful and Be rich.
Note: If you've got a lot of money you can get out right away otherwise you can join with a swing trade robbers and continue the heist plan, Use Trailing SL to protect our money.
Stop Loss : Recent Swing High using 1h timeframe
Warning : Fundamental Analysis comes against our robbery plan. our plan will be ruined smash the Stop Loss. Don't Enter the market at the news update.
Loot and escape on the target 🎯 Swing Traders Plz Book the partial sum of money and wait for next breakout of dynamic level / Order block, Once it is cleared we can continue our heist plan to next new target.
Support our Robbery plan we can easily make money & take money 💰💵 Follow, Like & Share with your friends and Lovers. Make our Robbery Team Very Strong Join Ur hands with US. Loot Everything in this market everyday make money easily with Thief Trading Style.

NATGAS OutlookPAIR:
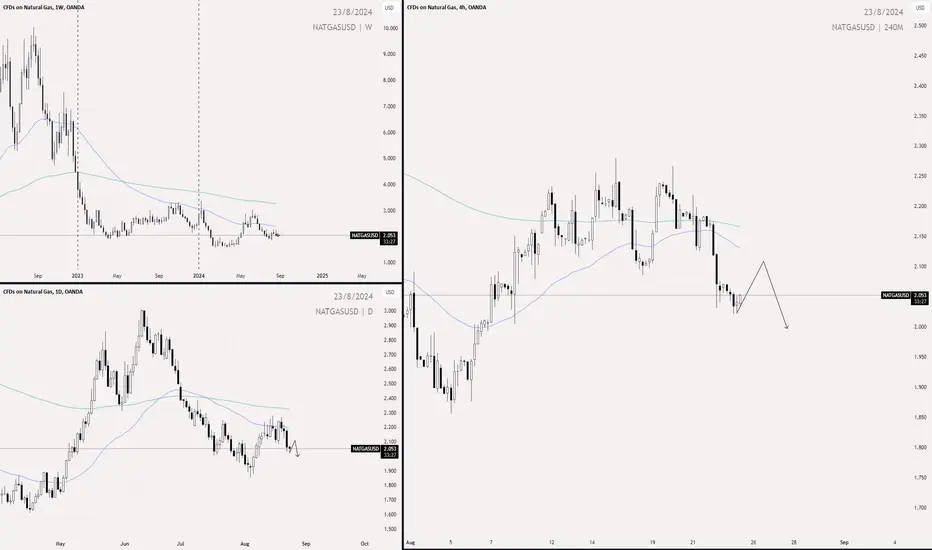
Bearish Outlook:
NATGAS has been breaking into new lows on our Weekly, Daily, and 4hr time frame. I would like to see price make a pullback followed by 1 of our valid-engulfing-candles while staying below the 50ema.
Natural gas falls as Middle East ceasefire talks progressNatural gas falls as Middle East ceasefire talks progress
On Friday the Natural Price decreased by almost -4.5%
This was related to fears that weaker demand from major NG importers could weigh on market sentiment.
Investors focus on the progress of ceasefire talks in the Middle East, which could reduce supply risks.
NG was also followed by a drop in oil prices. We didn't have a different move on fuel prices as we are used to when Oil and NG move in different directions. News about the ceasefire in the Middle East is supporting the decrease in fuel prices
NG may rise slightly for a small correction before it moves down more up 2.00 and lower as shown on the chart
You may find more details in the chart!
Thank you and Good Luck!
❤️PS: Please support with a like or comment if you find this analysis useful for your trading day❤️

Continued growth of NaturalGas H4. 23.08.2024Continued growth of NaturalGas
The price bounced perfectly from the margin zone
and confirmed the pattern Repositioning.
Further I expect an internal pullback and continuation of growth
to 2.35 and next target at 2.52.

Natural Gas: are bulls capitulating? The bulls have made 9 attempts at breaking out. All attempts have failed which has led us to this sharp decline.
Nat gas is holding the 20 day MA but it does look somewhat vulnerable to going lower.
The death cross is getting closer and closer as we approach the 50 MA & 200 MA downtrending intersection.
Our members stopped out of the second half of UNG in profits
I am now hoping and waiting for a sub $2 pierce retest. we shall see if we get it.

NaturalGas (SHORT) Hourly1. There is a fake breakout in the hourly time frame, perhaps the price may go lower.
2. According to the wave, the 2nd wave of the bear side has just ended.
3. There is opportunity for a bearish side by keeping stop loss at high of 2.3420.

Natural Gas Looks Poised for a 7.65% SurgeAfter a 39% decline since June, natural gas prices seem to have bottomed out on August 5th. However, after the initial bounce, the price has been consolidating over the last 9 days, forming an inverse Head & Shoulders pattern. This pattern suggests that a breach of the $2.38 level could potentially lift the price by 7.65%, targeting the $2.57 level.
This content is not directed to residents of the EU or UK. Any opinions, news, research, analyses, prices or other information contained on this website is provided as general market commentary and does not constitute investment advice. ThinkMarkets will not accept liability for any loss or damage including, without limitation, to any loss of profit which may arise directly or indirectly from use of or reliance on such information


NATGAS BUY LONG👉🏻 Navigating the markets with a clear trading strategy is essential for success. 📈 The chart shows an interesting setup for a potential long trade on Natural Gas (NATGAS), in line with the market cycle theory.
📌 Pattern analysis: The price has recently broken a descending trendline, which is a potentially bullish signal. After a retracement towards the 0.618 Fibonacci level, the price has formed a solid support, highlighting a key demand area. This zone is well marked by the gray rectangle, indicating an accumulation region.
📌 Next move: With an upward breakout confirmed, we see a clear potential for growth towards the target indicated in the green area, with a target of 2.600. This move is reinforced by the recent positive reversal, suggesting a trend change is underway.
📉 Risk management: The stop-loss level is strategically placed below the recent low at 2.084, which allows minimizing losses in case of false signals. The risk/reward ratio appears favorable, making this setup interesting for long-term-oriented traders.
👉🏻 Conclusion: As always, capital protection is crucial. By following this strategy based on solid technical analysis, you can identify an entry opportunity with well-calculated risk. Patience and discipline in following the trading plan are keys to long-term success.
📩 If you have any questions or want to discuss this analysis further, leave a comment or send us a message. We’re here to help! 😃

NATGAS inverse H&SNATGAS creating an Inverted HS. First objective 2.80$.
Keep in mind there’s a larger inverted HS on the making, which could throw the price beyond 4$

Natural gas is the downtrend resuming? Nat gas still fits all the criteria for a large downtrend.
Lower highs & Lower lows are still in place on the weekly timeframe.
This obviously swings probabilities in favour of lower price.
However historically were still at some oversold levels.
Just because this asset is oversold honest mean it can't go lower.
Im watching the daily 50MA & 200MA closely...do we get the death cross formation to occur again?
Usually this signal provides a near term bounce but medium term decline.

$NG: Bearish decline now switched off, potential reversal on!Bearish Decline from June to August 2024
The AMEX:NG market has experienced a significant bearish trend, beginning from the high of $3.192 on 11 June 2024. This marked a crucial peak before prices entered into a pronounced downtrend. The decline intensified after 25 June 2024, following three failed attempts to breach the declining trendline. These failed tests solidified the bearish momentum, driving prices lower as market participants lost confidence in the possibility of a reversal.
The initial phase of this downtrend was marked by steep declines as bearish sentiment dominated the market. Prices continued to fall sharply, with little to no relief rallies, reflecting a market overwhelmed by selling pressure. However, the decline began to decelerate around 9 July 2024, transitioning from a steep drop to a slower, more gradual downtrend. This period of slower decline lasted for about a month until 7 August 2024, when a notable shift in momentum began to emerge.
Shift in Momentum and Trend Reversal
On 7 August 2024, the natural gas market began showing signs of a potential reversal. This shift was confirmed when prices broke through the yellow trendline that had defined the bearish decline. The break of this trendline was significant, as it indicated that the market was no longer confined to the downward trajectory that had dominated since mid-June.
Following this breakout, the price rapidly tested and retested the original bearish gradient around 8 August 2024. This action suggests that the market was determining whether the bearish trendline would now act as resistance or if the breakout was strong enough to sustain a new upward trend. The successful breach and subsequent holding above this gradient marked the beginning of what appears to be a new bullish phase.
Potential Price Rise and Resistance Levels
With the trend reversal underway, the market is now poised to test key resistance levels. The immediate target is the resistance around $2.47, which represents an 11% increase from current levels. This target is realistic given the support levels identified at $2.16 and $1.91, which have provided a foundation for the recent price action.
The white line on the chart suggests potential price rise fluctuations, leading to $2.47 by 27 August 2024. This would represent a significant recovery from the lows and could set the stage for further bullish momentum.
If the bullish momentum that began around 5 August 2024 continues, the market could see a high-velocity price change between $2.47 and $2.87, representing a 12% increase. This scenario is plausible if supportive factors, such as clearer forecasts of winter demand and inventory reports, continue to drive market sentiment. The blue rectangle on the chart and corresponding volumes indicate that increased trading activity and bullish interest are backing this potential rise.
The timeline for reaching $2.77 by 13 September 2024 is also feasible, representing a 25% increase from current levels. This would require sustained bullish momentum and possibly some positive fundamental news regarding supply-demand dynamics as the market approaches the winter season, a period typically associated with higher natural gas demand.
Conclusion
The natural gas market is currently in a critical phase, transitioning from a prolonged bearish decline to a potential bullish reversal. The key levels to watch are the $2.47 resistance, followed by $2.87 if the bullish trend strengthens. Market participants should monitor volume trends, winter demand forecasts, and inventory reports, as these factors will likely influence the market's trajectory in the coming weeks. The timeline to mid-September 2024 will be crucial in determining whether this bullish reversal can be sustained, potentially leading to a significant recovery in natural gas prices.

CFD.Natural.Gas (Y24.P2.Video1)Bullish structure in the makingHi Traders,
Here are my thoughts for this structure.
Ranging price in accumulation mode and finding the good entry or breakout might align with price hikes for Gas as inflation rises and Europe struggles with supply.
All the best,
S.SAri

NATGAS Will Continue The Bullish TrendThe recent rise in gas prices is likely to be due to a technical reaction to the previous downward trend and the geopolitical situation.
Since it is well known that "the trend is your friend", the question arises as to possible price targets for any long trends.
An area of several open intraday gaps from mid-July 2024 is a good place to start.
If we choose this zone as a price target for a long trade, we can realize an acceptable RRR of around 1.1:1.

Natural gas harmonic and reversal structureLooks like copper is putting in its first weekly higher low with a potential IVHS reversal structure at the bottom and at the completion zone of a bullish wave structure.

Natgas chop - overhead resistanceDaily 50 ema is the white line. Strong resistance.
We've now formed a trendline along recent tops.
We'd need to break the trendline, and also close close a daily candle above the Daily 50ema.

NATGASUSDBUY on the theory markets ranges 70% of the time, and BUY on the theory markets retraces HALF of the previous leg 90% of the time.
I recommend getting in now.


Natgas - Head and shoulder. In bound Aug 8th 2024 playing out nGot 180k on boil calls @ $12 for sept 13
Will it make a widow of me?
We will see

NATGAS - NEW BREAKOUT !Hello Traders !
On Friday 2 August, The NATGAS reached the support level (1.893 - 1.854).
At the moment, The price broke the resistance level (2.110 - 2.059).
The resistance line was also broken!
So, I predict a bullish move🚀
___________
TARGET: 2.213🎯

Weekend Russia-Ukraine Update for Natural Gas Traders in FX MarkHey everyone,
I wanted to share some important updates with you regarding recent developments that could significantly impact our natural gas trades. In the past few days, Ukraine's attack on the Sudzha gas transfer station in Russia's Kursk region has raised some serious concerns. As you know, the Sudzha station is a critical point for gas flow from Russia to Europe, and any disruption here could directly affect our natural gas trading. It's something we all need to keep a close eye on.
To give you some context, Gazprom supplied approximately 14.9 billion cubic meters (bcm) of gas through Sudzha in 2023. This volume accounts for about 4.5% of the EU's annual consumption and nearly half of all Russian gas exports to Europe. Since the beginning of the year, the daily gas flow through this station has remained above 40 million cubic meters. These numbers highlight just how vital Sudzha is for European gas supply.
The main function of the Sudzha gas metering station is to record gas consumption and measure the quality indicators of the gas. The gas flow is measured using two primary methods: variable pressure drop and the more precise ultrasonic method, which measures the propagation speed of ultrasonic waves in the gas flow. The station is equipped with converters, pressure and temperature sensors, shut-off valves, and other equipment essential for accurate gas flow measurement.
In addition, the station features an automated control system that collects, processes, and transmits data on gas parameters. This system is responsible for overseeing the operation process and maintaining accurate records. If there’s an issue at the station, not only would the gas flow be disrupted, but tracking the quality and quantity of the gas would also become much more difficult.
Given these details, it’s crucial for us to closely monitor what's happening in the gas markets and adjust our strategies accordingly. As uncertainty increases, so do the potential risks and opportunities, so I strongly advise you to carefully set your stops in your trades.
Wishing you all a profitable week ahead!
CAPITALCOM:NATURALGAS FOREXCOM:NATURALGAS
