Supply surplus pressure XNG price despite demand increaseFundamental:
Natural gas (XNGUSD) continued its decline, driven by high storage levels and surplus supply. Despite a 6.8% increase in demand for the week ending 30 Jul, the daily average supply surplus remained at 3.6 bln cubic feet, boosting underground working storage capacity to near the five-year average high. The persistent supply surplus could exert further downward pressure on natural gas prices.
Technical:
The price remains within the descending channel. Unless broken decisively, trend favors lower prices.
If the RSI hits oversold and the price breaks $2.91, the next target could be testing the long-term support at $1.85.
Reversal would require a break and close above the descending channel and above clustered EMAs, ideally crossing $3.07 (EMA50) and $3.16 (EMA100).
MACD bullish cross with RSI rising above 50 would confirm a potential upward momentum.
Price may oscillate between current support ($2.91) and resistance ($3.16-$3.30) if volume and volatility remain low, consolidating before the next major move.
NATURALGAS trade ideas
Bearish forcast On Naturalgas Keypoints -
1. +48 Bcf EIA storage build beat forecasts and the 5-year average, signaling excess supply
2.U.S. dry gas production hit 108.1 Bcf/day
3.The next major downside level will be at $2.574. With fundamentals pointing to an oversupplied market and only short-term weather demand offering support, near-term sentiment remains bearish.

Gas Market Expectations: Seasonal Peaks, Storage MomentumNatural gas prices are largely aligned with historical norms, with the Q contract nearing its 15-year median as expiration approaches and summer-autumn 2025 contracts trading slightly above median levels but within the interquartile range. In contrast, winter 2026–27 contracts remain firmly above the upper quartile, pointing to persistent long-term risk pricing. Despite some normalization in 3-year forward pricing, the curve continues to show significant distortions at both short- and long-term horizons. On the fundamentals side, storage is projected to grow by +33 BCF in mid-July, with levels tracking well above the 5-year median. Weather-driven demand has begun to ease nationally, though regional deviations remain (especially in the Central and Mountain areas), highlighting the importance of localized heat trends in shaping market sentiment.
The expiration of the Q contract is approaching. Its price is now very close to the 15-year median on the expiration date. We expect high volatility in the near-term and upcoming U contracts. Prices for subsequent contracts have remained relatively unchanged. Autumn 2025 contracts are trading slightly above their historical median expiration values but remain within the interquartile range. Winter contracts for 2026 and 2027 continue to trade above the upper quartile.
Although 2025 contracts with three-year forward delivery have approached the price levels seen in comparable 2023 and 2024 contracts, the forward curve still shows a significant distortion in both the short-term (1–2 years) and long-term (5–6 years) delivery segments.
For Week 29 (July 14–20), a storage injection of 33 BCF is expected. The storage level remains confidently above the 5-year median. Injection rates continue on a positive trajectory. If the current supply-demand balance holds, peak 2024 levels may be reached. However, weather and seasonal patterns in late summer and early autumn remain a key limiting factor.
In the current Week 30, despite earlier expectations of a rise in HDD+CDD, weather conditions have stabilized around the 30-year median. Week 31 is forecast to be slightly above the median. The seasonal weather peak appears to have passed, with HDD+CDD values expected to decline further.
Looking at regional breakdowns for Week 30, there is a notable drop in HDD+CDD in the MOUNTAIN and PACIFIC regions, and a slight exceedance of the upper quartile in the Central regions. Other regions fall within the interquartile range for Weeks 30–31.
In the current Week 30, the supply-demand difference has dropped below the median. This is primarily due to decreased exports to Mexico and continued growth in domestic production. LNG exports remained stable.

"NATURAL GAS PRICE THEFT IN PROGRESS – JOIN THE HEIST!"🔥 XNG/USD HEIST – BEARISH LOOT AWAITS! SWIPE & ESCAPE BEFORE THE COPS ARRIVE! 🔥
🌍 Greetings, Fellow Market Robbers! (Hola! Oi! Bonjour! Hallo! Marhaba!) 🚔💸
🚨 Mission Briefing:
Based on 🔥Thief Trading Intelligence™🔥, we’ve identified a prime robbery opportunity in the XNG/USD (Natural Gas) Energy Market. Our Bearish Heist Plan is locked & loaded—long entries are a trap, and the real loot lies in the downside escape.
🎯 Heist Strategy:
Entry (Swipe the Loot!) 🏦
"The vault is cracked! Bears are distracted—time to steal!"
Sell Limit Orders preferred (15m-30m pullback entries).
DCA/Layering Strategy for maximum loot efficiency.
Stop Loss (Escape Route) 🚨
SL at nearest swing high (4H basis) – 3.480 (Day/Swing Trade)
Adjust based on risk tolerance, lot size, & number of orders.
Target (Police Evasion Zone) 🎯 2.900 (or earlier if cops close in!)
🔪 Scalpers’ Quick Heist:
Short-side scalp ONLY!
Big money? Go direct. Small stack? Join the swing robbers.
Trailing SL = Your Getaway Car! 🚗💨
⚡ Why This Heist? (Bearish Forces at Play)
Fundamentals: Oversupply, weak demand, storage glut.
Technicals: Overbought, trend exhaustion, reversal signals.
Sentiment: Bulls are overconfident—perfect trap setup!
📰 Breaking News Alert (Stay Sharp!)
High-impact news = Volatility spikes!
Avoid new trades during releases.
Trailing SL = Your Shield. (Lock profits before the cops raid!)
💥 BOOST THIS HEIST!
👉 Hit LIKE & FOLLOW to fuel our next robbery! More loot = More strategies! 🚀💰
⚠️ WARNING (Legal Escape Plan):
Not financial advice!
Your risk, your loot.
Markets change—adapt or get caught!
🤑 NEXT HEIST COMING SOON… STAY TUNED, ROBBERS! 🐱👤🔥

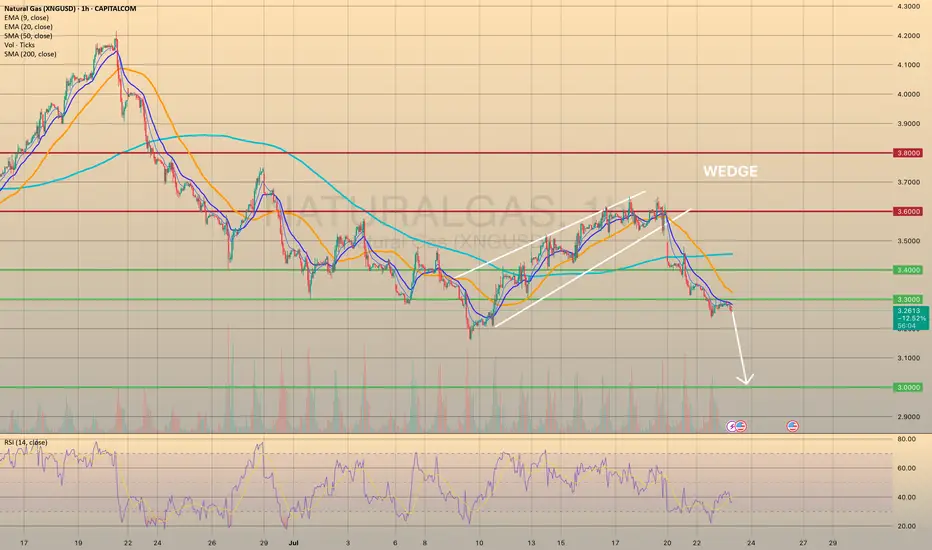
XNGUSD PULLED BACK FROM 3.3000 RESISTANCE LEVEL. WHERE TO GO NEXXNGUSD PULLED BACK FROM 3.3000 RESISTANCE LEVEL. WHERE TO GO NEXT?
This Monday natural gas prices have successfully broken down bearish wedge formation. As we may observe, the price went down through all major support levels, establishing a new short-term bearish trend. Recently the price broke through the 3.3000 and successfully retested it. It is crucial, due to this level is the last mid-term major support before the 3.000.
Additionally, the weather in the vast area U.S. is supposed to be milder at the end of July - beginning of August, which would curb nat-gas demand from electricity providers for air conditioning usage. To sum up, the decline towards 3.000 level is expected.
natural gas xngusd long point
2 buy zone marked on the chart with no stop loss
based on price action
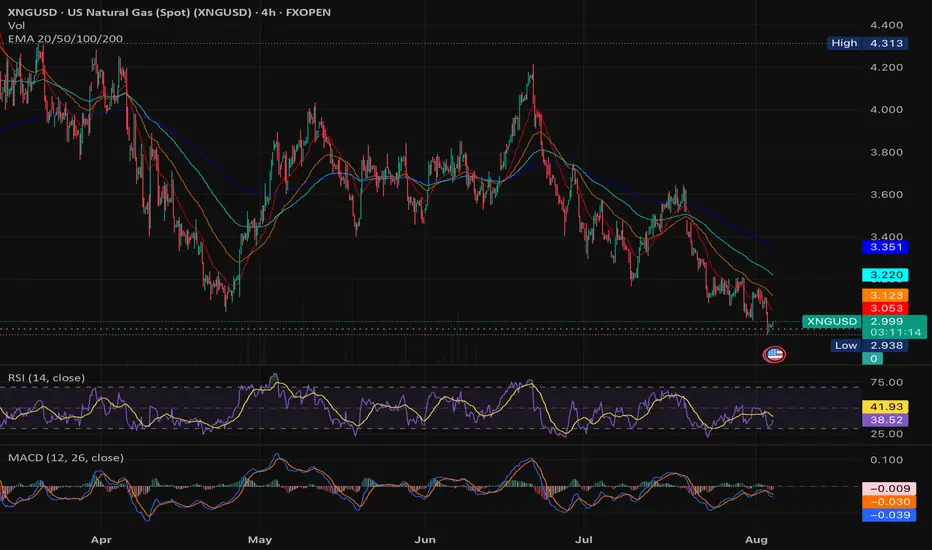
Natural Gas Price Drops by 7%Natural Gas Price Drops by 7%
As the XNG/USD chart shows today, natural gas is trading around $3.333/MMBtu, although yesterday morning the price was approximately 7% higher.
According to Reuters, the decline in gas prices is driven by:
→ Record-high production levels. LSEG reported that average gas output in the Lower 48 rose to 107.2 billion cubic feet per day so far in July, surpassing the previous monthly record of 106.4 billion cubic feet per day set in June.
→ Favourable weather forecasts. Although the peak of summer heat is still anticipated, forecasts indicate that temperatures over the next two weeks may be lower than previously expected.
As a result, today’s XNG/USD chart appears bearish.
Technical Analysis of the XNG/USD Chart
The chart indicates that since mid-May, natural gas prices have been fluctuating within a descending channel (marked in red), with July’s peak (E) highlighting the upper boundary of the pattern.
A key resistance area is now represented by a bearish gap, formed between:
→ the former support level at $3.525;
→ the $3.470 level – which, as the arrow suggests, is already showing signs of acting as resistance.
Under these conditions, it is reasonable to assume that the price may continue forming a downward market structure A-B-C-D-E, consisting of lower highs and lows, potentially moving towards the channel’s median – which approximately corresponds to July’s low (around the $3.200 level).
This article represents the opinion of the Companies operating under the FXOpen brand only. It is not to be construed as an offer, solicitation, or recommendation with respect to products and services provided by the Companies operating under the FXOpen brand, nor is it to be considered financial advice.

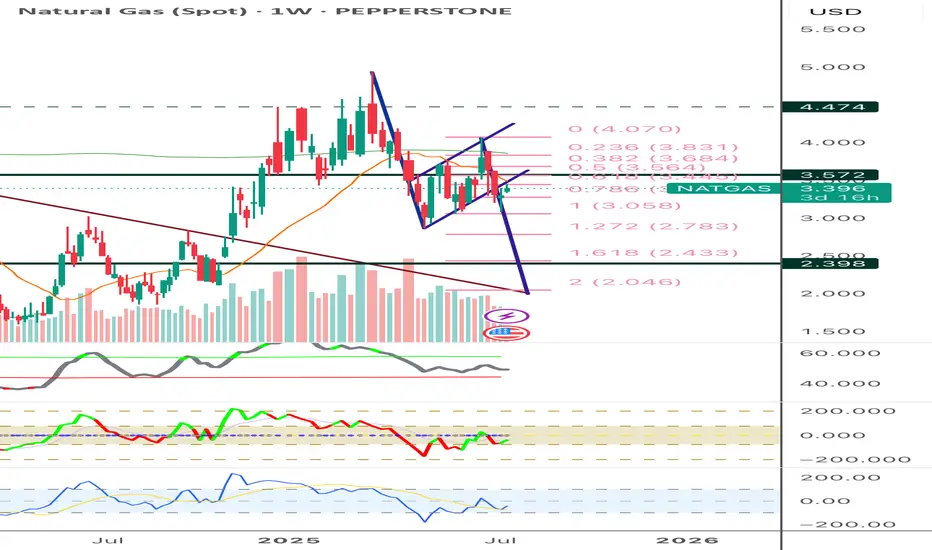
Natural gas spotHead and shoulder pattern observed and neo wave wise also appear either neutral triangle , if break neck line good fall and then near another bigger head and shoulder neckline. Let see

U.S. NATURAL GAS - BEARISH WEDGE WORKED OUT. WHAT'S NEXT?U.S. NATURAL GAS - BEARISH WEDGE WORKED OUT. WHAT'S NEXT?
Today, the market opened 2.66% below its closing price on Friday. The current price has already fallen on 4.8% since the closing on Friday, and it is now above the 3.400 support level. I expect further decline, however, with a possible rebound from the current level and pullback towards the SMA50, with a final target of 3.000.

Natural Gas two possible scenarioNatural Gas is testing major structure level. I provided two possible scenarios with low risk and good win ratio.

Natural Gas is in the Buying DirectionHello Traders
In This Chart NATGAS HOURLY Forex Forecast By FOREX PLANET
today NATGAS analysis 👆
🟢This Chart includes_ (NATGAS market update)
🟢What is The Next Opportunity on NATGAS Market
🟢how to Enter to the Valid Entry With Assurance Profit
This CHART is For Trader's that Want to Improve Their Technical Analysis Skills and Their Trading By Understanding How To Analyze The Market Using Multiple Timeframes and Understanding The Bigger Picture on the Charts

Nat Gas spotMade Bearish butterfly and Bearish dragon too but only presenting butterfly and also appear end of wave X as 81% retracement form one previous top also completed. let see

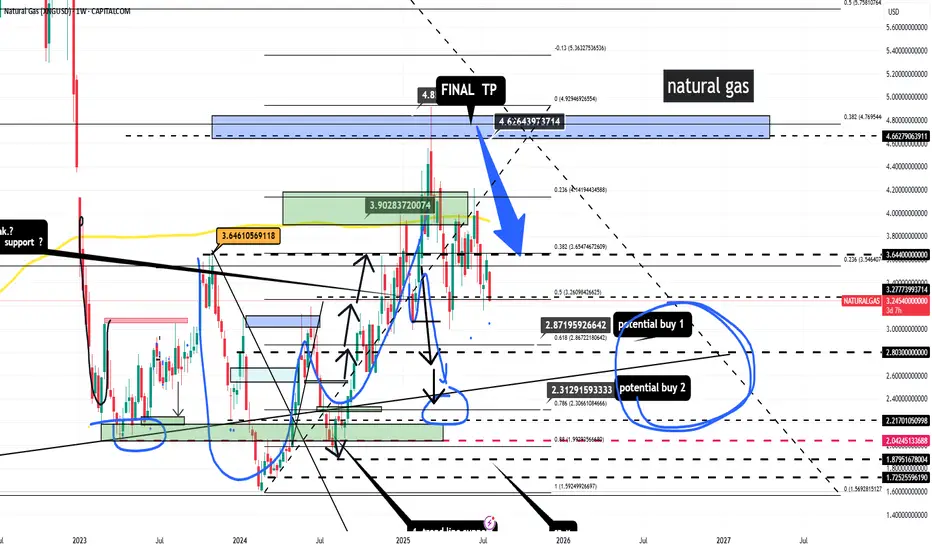
Natgas long term target 4Natural Gas (NATGAS) | 4H Chart Analysis
We are seeing a strong technical setup developing on Natural Gas. Price has recently bounced off a key ascending trendline support around the 3.00–3.10 area, with clear higher timeframe structure still intact.
Trade Plan:
Entry: Around 3.10, after confirming support at the rising trendline.
Stop Loss: Below 2.94 support (invalidates the bullish setup).
Targets:
TP1: 3.32 (first resistance, previous highs)
TP2: 3.57
TP3: 3.79
Final TP: 4.04
Trade Rationale:
Strong trendline support and recent bullish reaction.
Clear stepwise resistance levels to take profit along the way.
Risk well-defined below previous swing lows and support.
Things to Watch:
A daily close below 2.94 would invalidate this long setup.
Monitor for bullish volume on up-moves and news catalysts (storage data, weather, etc.).
Personal note:
This is not financial advice, just sharing my technical view for educational purposes. Please do your own research and manage your risk!

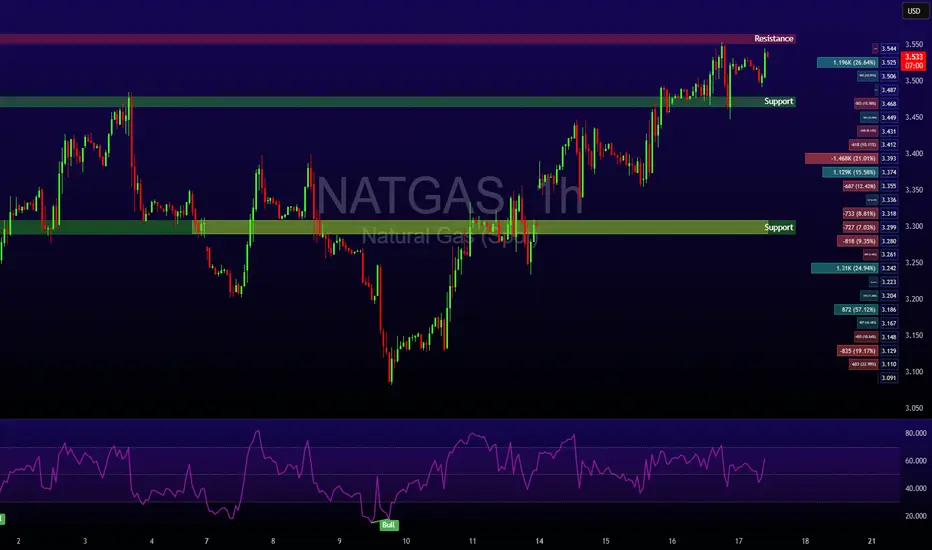
Heatwave Fuels Breakout as Fundamentals AlignNatural Gas has reclaimed the spotlight with a sharp move above $3.56, breaking through a key resistance level as a heatwave grips large parts of the United States. With above-average temperatures forecast to persist into late July, demand for cooling remains elevated, significantly boosting power consumption across the board.
Supply remains tight despite elevated production levels. Liquefied Natural Gas (LNG) feedgas volumes are rising as export demand holds strong, keeping domestic stockpiles in check. While some temporary relief in demand could arrive next week, the broader outlook remains bullish. Weather models suggest persistent heat, and traders are increasingly positioning for sustained tightness in the balance of supply and demand.
Technical Setup:
• Key level breached: $3.48 (100-day EMA) decisively broken
• Current price zone: Approaching $3.57, the next major pivot
• Momentum: If bulls secure a weekly close above $3.57, the market could enter a longer-term uptrend with $3.65 and $3.80 in sight.
Takeaway: Natural gas traders should monitor weather patterns and storage data closely. Sustained heat could keep the rally intact, but short-term pullbacks may offer entry points for trend-followers.
U.S. NATURAL GAS - BEARISH DIVERGENCE DETECTED
U.S. NATURAL GAS - BEARISH DIVERGENCE DETECTED🕵🏻♂️
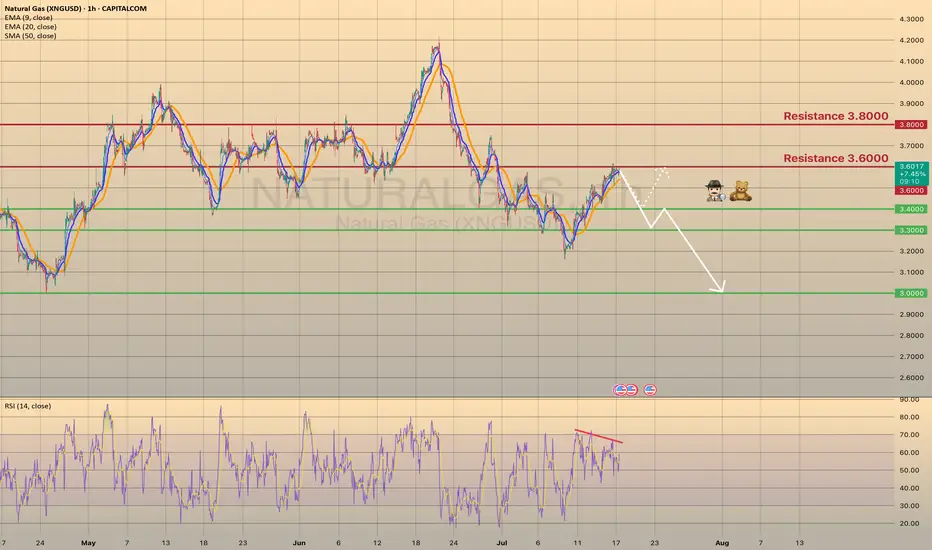
The Natural gas has been trading bullish for 7 days in a row since last Wednesday, reaching the 3.6000 resistance level. Primarily this happened due to a warm weather in the U.S. states, that supports the demand on gas. Despite warmer-than-normal summer weather, analysts expect energy firms to inject more gas into storage than usual in coming weeks. Record-high output in June, likely to be surpassed in July, and reduced gas flows to LNG export plants since April's peak, support this trend.
Technically chart shows us a bearish divergence on 1-h timeframe. I suppose the price to slowly decline towards major support level of 3.0000 with minor rebounds. The 2nd option is the rebound from 3.4000 support level with a first target of 3.6000.
NATURAL GAS - STILL IN THE GAME TRADING IDEA UPDATE -
NATURAL GAS - STILL IN THE GAME🔥
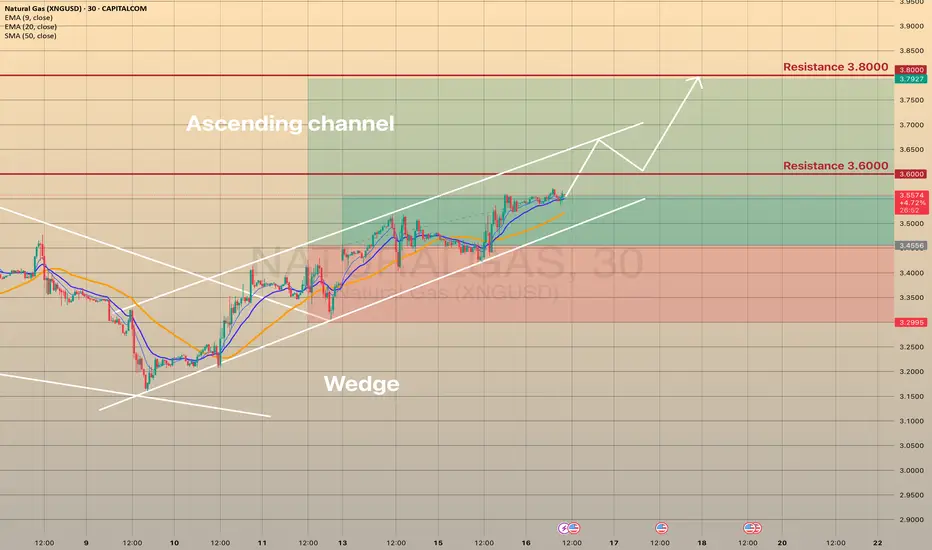
The XNGUSD goes quite well, as predicted. It held the trendline and moving upwards slowly, but surely. Short-term support here is the EMA20 on 4h timeframe. The asset is just below 3.600 resistance level and sma200. Since the July 10, the asset seems to be moving within the ascending channel (pic 2). I expect that the price will break the 3.6000 resistance level, will go towards upper channel border and then, after quick retest, move towards 3.8000. Not a trading advice! Trade cautiously!
Natural Gas Spot Well trying to read this complex correction again and assuming this is larger x wave or f wave if diametric in intermediate degree and time confirmation yet to come if next high previous fall not passed with in that time, then new low again possible, Let see. Not a sebi registered analyst, just personal view

Natural Gas NGThis is just for my own learning purposes. To keep track of how indicators work. This is not for trading.
NATURAL GAS - REBOUND FROM THE MAJOR TRENDLINE AND ANOTHER LONG CAPITALCOM:NATURALGAS
Last week on Wednesday and Thursday we observed the false breakout of the major trendline. Eventually, Thursday ended up bullish, gaining 4.8% day-to-day. On Friday the asset has been trading majorly sideways, retesting the major trendline (pic 1). Technically, looks like the divergence on RSI, MACD and Momentum works out as well as the bullish wedge (pic 2). Fundamentally, we still have warm temperature weather forecasts in the U.S. and bullish Thursday's EIA report. Additionally, today the market opened with a bullish gap and continues to grow, which is a good signal for the buyers.
Considering major levels here, I decided to open long positions:
🔼 a market buy order at 3.4556 with
❌a stop loss at 3.2995 and
🤑a take profit at 3.7927
At 3.6000 would be reasonable to reduce long position on a half. Thank you for the attention!

Natural Gas is in the Buying DirectionHello Traders
In This Chart NATGAS HOURLY Forex Forecast By FOREX PLANET
today NATGAS analysis 👆
🟢This Chart includes_ (NATGAS market update)
🟢What is The Next Opportunity on NATGAS Market
🟢how to Enter to the Valid Entry With Assurance Profit
This CHART is For Trader's that Want to Improve Their Technical Analysis Skills and Their Trading By Understanding How To Analyze The Market Using Multiple Timeframes and Understanding The Bigger Picture on the Charts

Potential Scalp Bearish Reversal Natural GasHello fellow traders, I will be giving my daily trade setups. I will be focusing day trading and scalping opportunities. I would like these posts to help others. Risk management is key.
Natural Gas appears to have made a bearish reversal divergence. Looking to short the bearish engulfing. I will be looking for a 2% drop down the 3.20, which is a previous support.

XNGUSD rebounded after tested the accending supportFundamental view:
Total US natural gas consumption rose 0.8% to 75.1 Bcf/d. Power sector demand increased 1.0% to 43.8 Bcf/d, driven by higher temperatures and increased air conditioning use. While total supply averaged 112.5 Bcf/d, down 0.6% from the previous week. Dry production decreased 0.6% to 106.2 Bcf/d. Net imports from Canada fell 1.4% to 6.3 Bcf/d. Rig count for natural gas fell by 1 to 108 rigs, indicating a slight reduction in drilling activity.
As a result, the working gas underground continued to increase above the 5-year average, nearly reaching its highest level in 5 years.
However, the higher-than-expected temperature and the demand from the EU, ASIA countries could support the price in the long term.
Technical view:
XNGUSD rebounded to $3.39/MMBtu on July 11, 2025, up 1.45% from the previous day, but is down 3% over the past month. Prices remain 45% higher year-over-year, reflecting a strong medium-term uptrend.
The price is consolidating above $3.20–$3.25 support, with a descending wedge pattern forming—often a precursor to a bullish reversal. The 100-period SMA is below the 200-period SMA, confirming a bearish bias, and the price is trading below both. The Stochastic Oscillator is oversold, and RSI is near technical bounce territory, but both indicate lingering bearish momentum.
A breakout above the wedge and the 100/200 EMA resistance, especially above $3.60, could trigger a rally toward $3.80 or even $4.00. Oversold momentum indicators and potential seasonal demand spikes could support this move.
Failure to hold $3.20–$3.25 support or persistent rejection at EMA resistance could push prices to $3.00 or even $2.70. Bearish momentum, increased inventories, or weak demand would reinforce the downside.

Natural Gas Bearish crab pattern may form may fall from here too due to wave structure and trend line resistance diametric pattern F wave also appear to forming.
View may change as per market structure.
Not SEBI registered RA or IA , personal view.
