NATGAS BuyNatgas is again approaching the usual support level around 1.613.
I think we can't go any lower than that, so it might be worth taking a long position.
The lowest possible can be 1,566.
NATURALGAS trade ideas

NATURALGAS - Blow Off PhaseNATURALGAS
Pumping today but its coming out of a long ascending channel.
So this is wild and dangerous.
It has again pushed through resistance into the higher liquidity area.
At some point it will likely collapse either to a Golden Window retracement or lower low 👍.
Not shorting.
Not advice

Simple and cleanThe current chart pattern perfectly fitting under "Bear Flag". Let's see how it works out

NATURAL CallsLooks like Natural Gas is trending in a channel and just landed on the its support area. Theres a high probability the price will reverse from this area as its been consolidating there for quite some time now.

My view on NG I can see some downtrend after hitting below 1.900 good for shorts
and I can see some good upward movement after hitting 2.55 to 2.7 would be great range for longs
Above mentioned views for purely positional trades

NGas is BullishI am expecting a continuation according to HTF and a high propability of a bullish movement after mitigating the FVG .
Happy trading.


Natural Gas April 22, 2024: Waiting to Break Above the ResistancOn April 22, 2024, CAPITALCOM:NATURALGAS is trading below the resistance of 2.04 - 2.05 (yellow line) from Feb 6, 2024, with 3 bottoms forming as shown on the chart.
A break above this resistance would trigger a buy signal with the target around 2.45 as shown on the chart, the same distance to the resistance as the from first bottom.

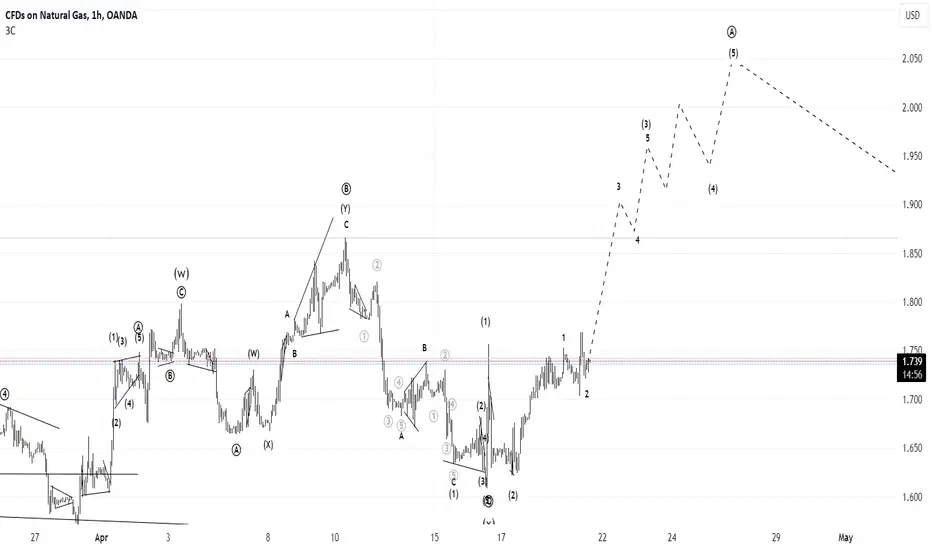
Maturity of the bullish market, any correction pattern extends tEsteemed analysts and traders,
I hope this correspondence finds you in good health and high spirits, prepared to tackle the upcoming week with renewed energy. I extend my best wishes for your continued success in all your business endeavors. It is worth noting that success in trading is largely dependent on the consistent definition and adherence to one's own rules.
As a supporter of the Elliott Wave Principle, I consider this methodology an invaluable tool for market analysis. After three years of personal experience, I have developed my approach by combining this principle with meticulous consideration of different market scenarios. I strive to avoid market surprises by maintaining a range of market prospects, which enables me to recognize the market structure forming with 100% accuracy.
I am pleased to share my analysis with you, with the caveat that I do not provide buy or sell signals. My perspective on idea analysis is entirely impartial, and if my analysis meets your standards, it may serve as a guide to making an informed decision.
For your reference and comparison, I have attached my previous analysis of the same market. All the details of my analysis are clearly labeled for ease of comprehension. Nonetheless, familiarity with the Elliott Wave Principle theory would facilitate an understanding of the analytical idea.
My study of the Elliott Wave Principle took nearly three years, during which my understanding and experience with this invaluable tool have grown. My progress thus far is a testament to the legacy of Ralph Nelson Eliot, whose genius has provided the foundation for my achievements. May he rest in peace.
I express my gratitude for your continued support and kindness, and welcome your comments and critiques.
May my analysis be a valuable asset to your business journey, and I remain sincerely yours,
Mr. Nobody

Natural gas long viewThe price of gas is moving away from the previous bearish trend. January and February were extremely bearish. March was a month of consolidation, and April initiated a bullish consolidation supported by EMA20 and EMA50 daily. The price is currently at the $2.05 level, and before the next bullish run, a pullback to the $1.95 support zone is possible.

Natgas UpdateSeems like natural gas is ready to explode in 3rd of 3rd Elliottwave. Oil has similar sentiment despite being less obviously bullish. Natural Gas remains so far firmly on track and expected to rise with oil, perhaps on the Middle East escalation in the most nearest future.
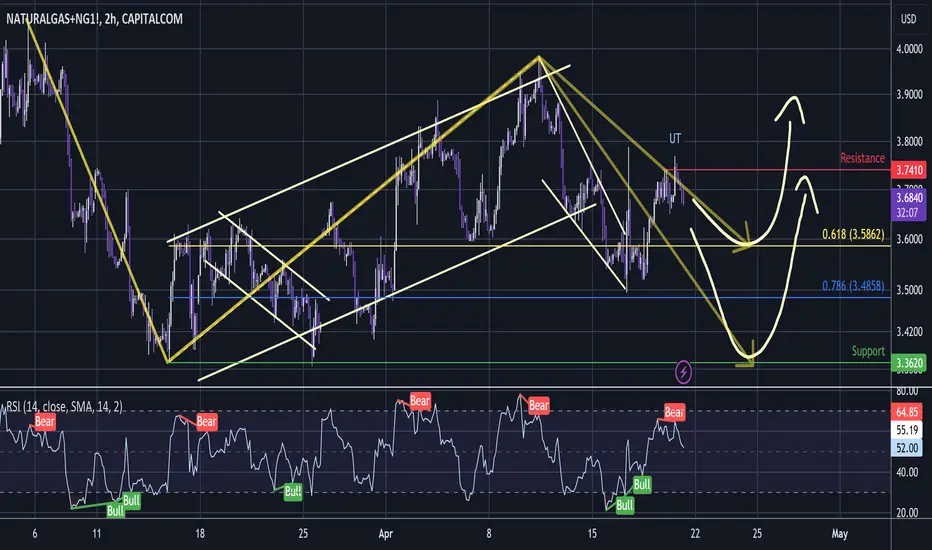
Natural Gas - Lower Time Frame UTNatural Gas
Now showing bearish divergence on the 3 hour chart after a higher high shakeout.
That is very likely to be a Wyckoff UT UpThrust.
This signals that the current wave up is now more likely to be a connective wave and there will be another bearish wave to follow.
Perhaps it gets back to somewhere around the 0.618 are perhaps it will get all the way back to the previous support low @$3.362 and that would complete a flat pattern.
Both are probably about equal odds and we'll need to see more.
I have taken some profit in this area but will hold a small amount through the area for long term👍.
Not advice
Potential SHARK Harmonic pattern forming on Natural Gas📈 Keep an eye on Natural Gas! 🦈 Potential SHARK Harmonic pattern spotted 📉
This pattern, known for signalling trend reversals 🔄, is gaining attention as it shows distinct Fibonacci ratios and price swings. If confirmed, it could mean significant price movements ahead.
The pattern involves four key points: the initial impulse leg, a corrective retracement, an extension leg, and a final reversal leg. Traders are watching closely as price action approaches the projected reversal point 🎯. Confirmation of the pattern often comes with additional technical indicators aligning with the reversal signal.
In the Natural Gas market, factors like supply and demand dynamics, geopolitical events, and weather patterns play a crucial role. Traders are combining technical analysis with fundamental insights to assess the pattern's validity and potential outcomes 🌍💡.
Stay alert and keep your risk management strategies in check! Whether the pattern leads to a bullish 📈 or bearish 📉 reversal, traders with a keen eye on harmonic patterns and market dynamics will be ready to seize the opportunities 💼💰.

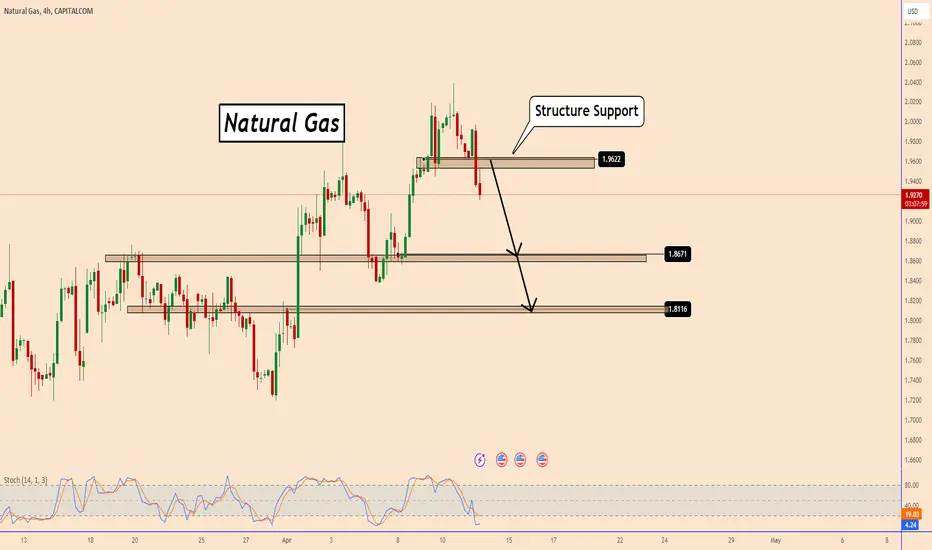
Natural Gas Technical AnalysisNatural Gas Technical Analysis
The price broke down from a minor structure support zone.
The first 4 hours candle closed red and looks a big candle, showing an increase in the bearish volume.
The first support will be found near 1.8670 and the second support near 1.8100
Don't forget that it is very risky trading NG due to the high speculation.
You may find more details in the chart!
Thank you and Good Luck!
❤️PS: Please support with a like or comment if you find this analysis useful for your trading day❤️
It's a matter of WHEN it explodes; not IF Don't know how this plays out in the short-term... but it will explode soon (likely this spring or summer at the latest). If it does flush lower one last time, I'm looking at the $1.30 region... hitting UBER oversold on the quarterly, monthly and weekly charts.

NGAS Upside Risk on Supply-Demand DynamicsNatural Gas prices have been dropping over the past four months due to progress on renewable energy and hot weather being among the drivers. However, market could become tighter this year, with slower supply growth and an acceleration in demand, while key US drillers have slashed their 2024 outlook. Further Middle East hostilities after the Iranian hit on Israel, could affect traffic and push prices higher.
On the technical front, the rejection of the EMA200 (black line) 23.6% Fibonacci of the 2024 high/low slump, make it vulnerable to new multi-year lows (1.523-13). Improving supply-demand dynamics though, can support a recovery towards the 38.2%, to what is a difficult technical path.
Stratos Markets Limited (www.fxcm.com):
CFDs are complex instruments and come with a high risk of losing money rapidly due to leverage. 66% of retail investor accounts lose money when trading CFDs with this provider. You should consider whether you understand how CFDs work and whether you can afford to take the high risk of losing your money.
Stratos Europe Ltd (trading as “FXCM” or “FXCM EU”), previously FXCM EU Ltd (www.fxcm.com):
CFDs are complex instruments and come with a high risk of losing money rapidly due to leverage. 70% of retail investor accounts lose money when trading CFDs with this provider. You should consider whether you understand how CFDs work and whether you can afford to take the high risk of losing your money.
Stratos Trading Pty. Limited (www.fxcm.com):
Trading FX/CFDs carries significant risks. FXCM AU (AFSL 309763). Please read the Financial Services Guide, Product Disclosure Statement, Target Market Determination and Terms of Business at www.fxcm.com
Stratos Global LLC (www.fxcm.com):
Losses can exceed deposits.
Any opinions, news, research, analyses, prices, other information, or links to third-party sites contained on this video are provided on an "as-is" basis, as general market commentary and do not constitute investment advice. The market commentary has not been prepared in accordance with legal requirements designed to promote the independence of investment research, and it is therefore not subject to any prohibition on dealing ahead of dissemination. Although this commentary is not produced by an independent source, FXCM takes all sufficient steps to eliminate or prevent any conflicts of interests arising out of the production and dissemination of this communication. The employees of FXCM commit to acting in the clients' best interests and represent their views without misleading, deceiving, or otherwise impairing the clients' ability to make informed investment decisions. For more information about the FXCM's internal organizational and administrative arrangements for the prevention of conflicts, please refer to the Firms' Managing Conflicts Policy. Please ensure that you read and understand our Full Disclaimer and Liability provision concerning the foregoing Information, which can be accessed via FXCM`s website:
Stratos Markets Limited clients please see: www.fxcm.com
Stratos Europe Ltd clients please see: www.fxcm.com
Stratos Trading Pty. Limited clients please see: www.fxcm.com
Stratos Global LLC clients please see: www.fxcm.com
Past Performance is not an indicator of future results.

Natural Gas (NGAS) - WEEKLY FORECASTForecast: Start of Bullish Trend (Daily)
Invalidation Level: 1.580
Only buy when the price is close to these levels: 1.745; 2.026 (R/S);

My View on Natural Gas for next weekThis is my view for NG next week.
If the price breaks 1.9666 we can see some good upward movements.
if the price fails to break this level if any rejection (red pipe) we can see a price drop up to 1.83.
Circled one is good spot for any trades for the next week.

xngusd tecnical analysisxngusd is ther support level its good time to buy xngusd for long term its the jackpot zone trader buy and hold your trades

I am lookin for the short trade in NGI can see main levels at 2.0053 1.9489 after immediate support at 1.91 and 1.8626 and last 1.71
If break all these supports we can see quick downfall.
I am on short side till now we can see

NATURAL GAS - Bullish Falling Wedge 📈Hi Traders !
The NATGAS Price Formed a Falling Wedge Pattern.
Currently, The Price Broke The Resistance Line !
So, I Predict a Bullish Move📈
-------------
TARGET: 1.908🎯

The aggressive idea of wave 1 and 2 was not invalidated!Dear analysts and traders,
I hope you are doing well and are motivated for the week ahead. I wish you all the success in your business endeavors. Remember that success in trading lies in consistently defining and sticking to your rules.
As someone interested in the Elliott Wave Principle, I find it to be an invaluable tool for market analysis. I have developed my approach by combining this principle with my personal experience and by considering different scenarios that are likely to occur in the market. It should be noted that I do not like to be surprised in the market, and that's why I have different market prospects. I follow them to be sure and recognize the structure that is forming so that I can 100% recognize it.
I will share my analysis with you, but please note that I am not providing any buy or sell signals. My perspective on idea analysis is completely unbiased, so if the idea analysis meets your standards, you can use it as a guide to make an informed decision.
I have attached my previous analysis of the same market so that you can compare and see the differences. All the details of my analysis are clearly labeled, making it easy for you to understand. However, having a basic familiarity with the Elliott Wave Principle theory will help you understand the analytical idea more easily.
I have been studying the Elliott Wave Principle for almost three years now, and over time, my understanding of this knowledge and experience has grown. What I have achieved so far is the legacy of a genius called Ralph Nelson Eliot, and I am really happy with my progress. May peace be upon him.
Thank you for your support so far. I will always remember your kindness. Please share your comments and criticisms with me.
I hope my analysis will be useful to you in your business journey, and I wish you all the best.
Sincerely,
Mr. Nobody

