XNGUSD Short BiasXNGUSD on the 30-minute chart is accompanied by drawn-in trendlines, a Fibonacci
retracement as well as an anchored VWAP and volume profile. An RSI indicator is also added.
Price hit a recent high of 2.81 on May 19th and then trended down to 2.11. While a 50%
retracement might have been expected ( to 2.46) price only rose to 2.42. I consider this as
showing selling pressure from sellers to be slightly exceeding buying pressure. Short bias
for XNGUSD is confirmed since it is trading below the POC line of the long-term volume profile
and below the anchored mean WVAP which are acting as confluent resistance. The RSI topped
out at 60 during the retracement and has fallen below 50.
Overall, the chart supports a short XNGUSD trade with a stop loss just above VWAP / POC
and the target the trendline of support ( green line ) making for a Reward: Risk of
about 2:1 Any leveraged forex trade would amplify both potential loss and potential
profit.
NATURALGAS trade ideas

XNGUSD- Spot Natural Gas Ascending WedgeAs shown on the 15 minute chart XNGUSD is in an ascending wedge pattern which is generally
considered bearish. In the past day, price has fallen slightly below the support trendline.
Is this a fake-out or a breakdown? The RSI had turned decidedly weak while the MACD lines
crossed above the histogram and are now under the horizontal zero line. These both suggest
a breakdown falling out of the pattern. Price was well above the high volume area of the
profile where there is little trading to support a further price rise. Overall, XNGUSD may have
went up too far and too quickly. I expect a full reversal as suggested by the mass index indicator
so I will short-sell this forex pair. with moderate leverage. The stop loss will be inside the
pattern just above the support trendline while the target is 2.35 about the value where price
started its previous uptrend.

NATGAS Supply Demand Buy AnalysisSee picture below for analysis
valid buy setup with price inside monthy demand + confirmation but smaller risk
as HTF is tested + counter-trend.

Natural gasNatural gas is on the verge of breaking historic lows amid geopolitical tensions. Year after year, increasing demand for natural gas causes gas prices to rise. My target is $2.07!

Buy Naturalgas Market Capital.comHere is a Scalp for the perfect Start in a new Week.
You can buy Naturalgas now, SL the Lower Line,
Profit the higher Line. 10% for this Setup
Good Luck

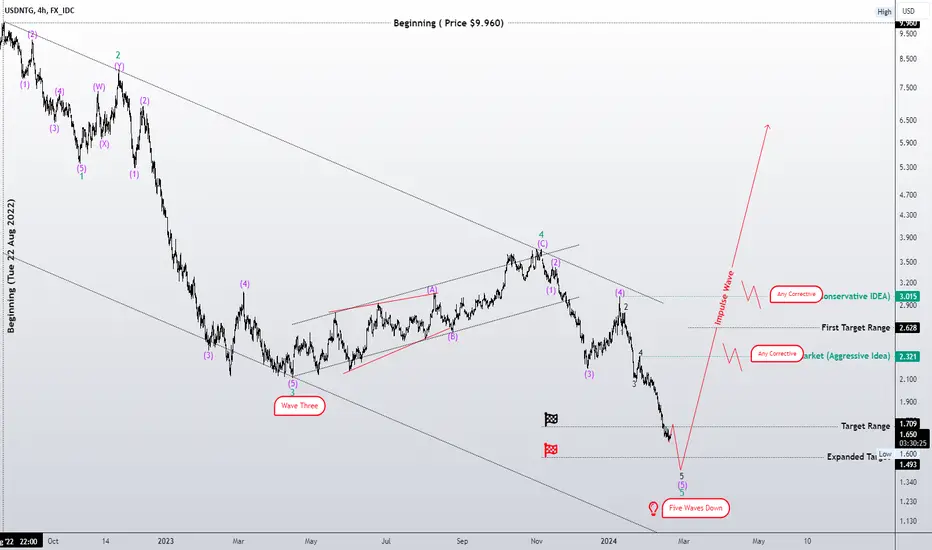
The gas will reach its lowest level(complex correction compoundsI hope this message finds you well and that you're having a great start to the week. I wish you success in your business endeavors.
As someone interested in the Elliott Wave principle, I find it a valuable tool for analyzing the market. I have developed my approach by combining this principle with my personal experience and by considering various scenarios that are likely to occur in the market.
I am sharing my analysis with you, but please note that I am not providing any buy or sell signals. I aim to share my unbiased analysis with you so that you can use it as a guide to make informed decisions.
In the attachment, you will find my previous analysis of the same market, so you can compare and see the differences. All the details of my analysis are clearly labeled, making it easy for you to understand (although having a basic familiarity with the Elliott Wave Principle theory will help you understand the analytical idea more easily).
I have been studying the Elliott Wave principle for almost three years now. With time, my understanding of this knowledge and experience has increased. What I have achieved so far is a legacy of a genius named Ralph Nelson Elliott, and I am truly satisfied with my progress. May his soul rest in peace and his memory be cherished.
Thank you for your support so far. I am grateful and will always remember your kindness. Please feel free to share your thoughts and feedback with me.
I hope my analysis will be useful to you in your business journey, and I wish you all the best.
Sincerely.
Natural Gas back at Covid lows!The widow maker continues to bleed lower and squeeze longs.
This is the exact opposite of a short squeeze. We're going through a long squeeze.
This commodity is at extreme low levels. Covid low levels when the GDP was contracting.
I believe an epic bounce will arise, but this has a history of extreme price action.
Natural Gas resource stocks are making bullish reversals, usually a good sign of a near bottom.

USNATGAS uptrendBased on the price action of USNATGAS, Ichimoku, Fibonacci levels, and support & resistance analysis, the target has been adjusted to 3.300, with a corresponding stop loss at 1.300.

Natty Gas Roadmap July 2023So this is the highest vol commodity so could make a quick 50-70% like that

NAT GAS LONG In confluence of trend line break and pull back on D1, Alignment of past fib levels and ABC correction elliot wave. I have come to a conclusion that price will rebound around 1.629.
Let me know if you have any questions.

Natural GASNatural GAS is at the ALL time LOW Zone and it could provide the BEST buy opportunity.
It would be worth watching the price.

NATURALGAS upside in 4h CandleIthink its going up to the Zone 2.32, this Zone is a big Sellingarea.
Buy wait, hold strong lower Laverage or open Margin.
Control the 4H, and Daily Candle

Rsi giving Resistance = Buy signal in Breakouthere in chart if you go deep dive properly bearish momemtum is about to shift. because from last 2 days market is not making bigger swings and Rsi is not weak enough in bearish movement. and we can easily see 4 times resistance in Rsi , so according to price action analysis more then 3 -4 time hitting support resistance make the level very weak . all things are coming together
1. Price is in very Demand zone (multi yrs )
2. Price is moving in downwards channel (9days consucative red candles)
3. Rsi retest resistance more than 4 times
4. momumtum lose by market by not making widers swings
note: We just need to make Higher High form once, then Rsi trendline will also be broken and we will see change in momemtum and change in price action...
Thank you all Traders

NATGAS_1D📊🔥Gas analysis in long term time frame Elliott wave analysis The market is in the 5 Elliott waves of decline, and we are currently at the end of the 5th wave of decline, which is very suitable for investment and purchase, and the market can enter an upward wave in the future. Main support range 1.000 to 1.600 Resistance and target 4.600, 5.600 and 6.600


Classic Double Bottom Formed here in chart we have seen a double bottom with divergence and over sold zone and most imp thing is in multi years demand area. so if market cross yesterday high then we can have agressive buying, finding the second leg of double bottom we can buy some quantity also. we will have break thorough of Double bottom pattern and we can target till 2.1 . as per chart i have found that we will have side ways market between 2.1 and 1.6 level before a breakout of proper Bull market. thank you all trader. its my small help for trader to support their trading...

potential reversal in this support if double bottom formreversal is only possible if market break minor resistace level then we wiill have change in character in market ....

NATGAS LONG TERM TRADE analysHello Traders
In This Chart NATGAS HOURLY Forex Forecast By FOREX PLANET
today NATGAS analysis 👆
🟢This Chart includes_ (NATGAS market update)
🟢What is The Next Opportunity on NATGAS Market
🟢how to Enter to the Valid Entry With Assurance Profit
This CHART is For Trader's that Want to Improve Their Technical Analysis Skills and Their Trading By Understanding How To Analyze The Market Using Multiple Timeframes and Understanding The Bigger Picture on the Charts

Natural gas $1.54 - $1.56 - watch that levelNatural gas has been shorted by several hedge funds including Citadel and AQR. It still has approximately 7-10% down price action to go from here. It is NOT safe to long, because natural gas has associated geopolitical risk. Fundamental reasons > technical analysis for this commodity. Unfortunately, it means natural gas can also go BELOW $1.50 (highly possible) given the geopolitical tensions between EU, Russia and the US. Thus, one has to be patient before longing natural gas, as there is high liquidation risk.

NATURAL GAS LONGI want to try this long, in my opinion probable reversal.
The real key regardless of any strategy is to have a decent risk/reward .
You win and you lose , so be cautious.
No financial advice, do your own research.

Natural Gas: Will it ever bounce?Nat gas continues to bleed lower and lower.
Anyone that's over leveraged has been destroyed.
We are now coming into a measured move target on Nat GAs.
This is where we should see a decent technical bounce.

Ending diagonal for the 5th wave down? Nat gas still getting punished but Im thinking we can get a bounce here in a D wave of a possible ending diagonal . Lets see if we can get a hammer or morning star candle today or tomorrow. Ill probe the long side here if we can get a bullish candle
