This is the time. Looking for big moves in energy. Natural gas looks fantastic.
A key level from history has been defended, markup next?
NATURALGAS trade ideas

NATURALGAS - First Correction Of Bull MarketPrinting shallow here and this is likely a 0.382 correction to begin the bull market.
Trundling down the Supply Line it could print a shakeout and have a stab down but we don't really mind, this is DEEP DEEP here and one day we'll look back and think about when NATURALGAS was sub $3.
Think about it - energy is going up up up.
This could be a multi year or multi decade bottom 🚀.
Hopefully my clients enjoyed this one and now here it is for you guys at TradingView to enjoy!
Not advice.

NATGAS (Spot) is higher.Natgas has broken accumulation and has rised. We can take a target profit by using Fibo extension.
Good luck.
Stop Loss is very necessary.

#NatGas UpdateI have almost gave up on the count with ongoing correction than suddenly noticed that it looks like an expanding triangle.

Natural gas breaks resistance, ending retracement phaseNatural gas has finally broken through resistance today, with US gas pushing through the $2.762 resistance level to bring about a fresh one-month high. Elevated stockpiles in Europe have subdued calls for another winter spike in Europe despite the need to once again source product from around the world in the absence of Russian imports. Nonetheless, todays breakout does signal a potential upside push from here, with the recent decline bringing price into the 61.8% Fibonacci support level. That retracement now appears to be over, with further upside looking likely as a result. Towards the upside, a target around $3 makes sense as this also represents the March peak.
A decline through the recent low of $2.48 would be required to negate that bullish outlook.

NATURAL GAS SWING3/6M:1-2 Bear RTM (Bullish)
Note:
Look for Bullish Patterns
Monthly 3 Bar Range (Look for Bo)

NATGAS BULLISH SETUP LONG UPDATEEasy long, easy money! NATGAS ended up doing exactly what I said, hope you caught on and made some money!

Natural Gas LongNatural Gas forming a butterfly in 4 hours timeframe and price action confirms the long side view in NATURAL GAS. SL will Be below 2.3$.

natural gas longnatural gas forming a bullish butterfly pattern, hence on can plan with minimum sl but only after proper confirmation

#NatGas UpdateThis week, natural gas performed nearly perfectly. The wave count remains unchanged. Although I am still unsure about the ultimate shape of wave b, the scenario allows me to open cautious shorts. Of course, this is not advice. I look forward to the structure shaping the bottom and entering long positions into the winter.

Natgas H&S formingClose above neckline will generate strong momentum to push prices through the next resistant to around 2.7$ area

Natgas H&S formingClosing above neckline will generate strong push up. Probably above recent major resistants above 3$

NATGAS BULLISH SETUP LONGNATGAS is making a rebound from the support level of 2.42 so I think that we will see a further move up.

Natural gas- Short Natural gas (spot) is still keeping down trend as it never gives a higher high but lower high.
In a minor trend, it can break a trendline and did a retesting. So, it is possible to go down.
So, we can look for short term trading with short positions.
Good luck.

✅NATGAS BULLISH SETUP|LONG🚀
✅NATGAS is making a rebound
From the support level of 2.42
So I think that we will see
A further move up
LONG🚀
✅Like and subscribe to never miss a new idea!✅

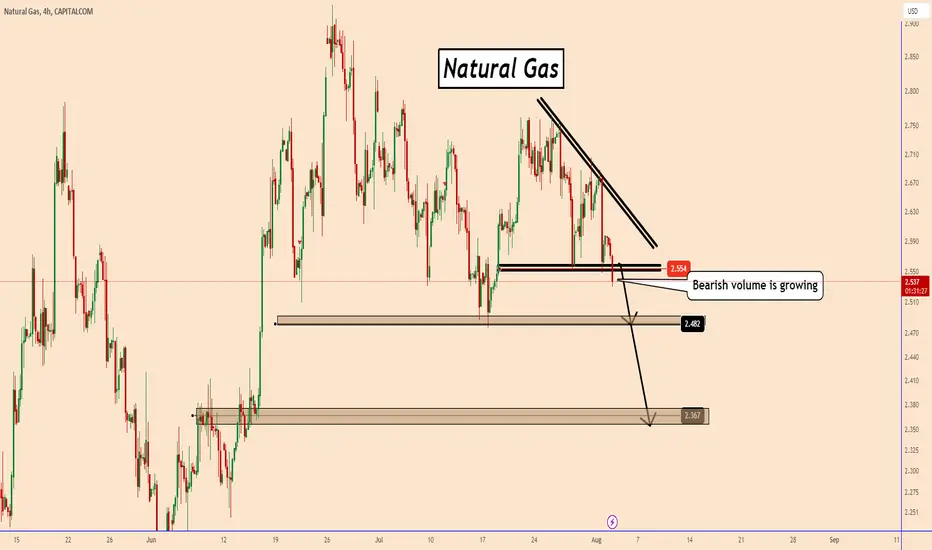
Natural Gas May Test 2.3 During This MonthNatural Gas May Test 2.3 During This Month
After a big corrective pattern where the price spend many days finally we can see NG
moving down again.
NG had a long time that it was not holding very well the bullish volume and a bearish movement was again on the cards.
The price broke below 2.55 today and it is increasing the chances that it can move down further and if all goes fine it may test 2.3 price zone this month.
Thank you and Good Luck!
Buy? or Bye? Still a little bit disappointed that the big move upwards didn't materialize mid July, BUT.. there's still a chance and I think this is a pivotal area.
I'm neautral ATM

NG consolidation and uptrendCan bulls take over the rally?
Disclaimer: I'm not a SEBI registered advisor. All posts are only for educational purposes.

NatGas Bullish WedgeA bullish wedge pattern breakout, which coincides with rising trend line support, has confirmed wedge resistance as new support. At the same time, price has also confirmed rising trend line support for the second time. Both seem to point to more upside. I'm looking for a measured move based on the wedge pattern up to about 3.35.

NATGAS | High RR TradeBought after seeing good reaction to the channel. Would also buy ~2.00$ for the winter.

An alternative view...Could be a measured moved down 🤔 The only thing I'm almost certain of, is no more sideways action...
Personally Sticking with the More Bullish scenario from my previous posts -But this would make sense- throw off a ton of retail longs and get an even better entry price.

Wishful thinking? Or calculated take off?
The reality is friends, nobody knows and if they did I doubt they would tell eveyone on TradingView - BUT... IMO, Out of all the things I'm charting this is the most likely to pop off.
Volatility incoming.
NFA 👍

NATGAS LONG TERM TRADEBUYINGHello Traders
In This Chart NATGAS HOURLY Forex Forecast By FOREX PLANET
today NATGAS analysis 👆
🟢This Chart includes_ (NATGAS market update)
🟢What is The Next Opportunity on NATGAS Market
🟢how to Enter to the Valid Entry With Assurance Profit
This CHART is For Trader's that Want to Improve Their Technical Analysis Skills and Their Trading By Understanding How To Analyze The Market Using Multiple Timeframes and Understanding The Bigger Picture on the Charts
