Natural Gas Breakout Ng Breakout has happened...there a Chance Ng can Trend up from here
So take a position
Bullish in Natural Gas...
Chance of 100-250% upside
NATURALGASCFD trade ideas

+90% Natural GasIs natural gas a good stock to buy?
When investing in natural gas stocks, it is important to look for companies with good financial stability, and a strong history of profitability. Natural gas stocks can be a good investment for stock market investors. This is because natural gas prices are expected to continue to rise in the future.

NatGas Daily Potential Bearish TradePEPPERSTONE:NATGAS
DATE: 25 September 2023
INSTRUMENT: Natural Gas
TIMEFRAME: Daily
COMMENTS:
Natural Gas Daily appears to have completed a complex Elliott Wave Pattern (Wave 4). Apparently price is setting to gravitate back to 1.61 - 1.467 price zone where we would expect price to bounce on those levels.
TRADE PLAN:
Look for confirmed bearish entries on lower timeframes

Natural Gas ScenariosIf the yellow curve does not hold, or the two red marked levels below, the white path with a continuation of the downward channel can be expected. Otherwise, we might see an attempt to shoot for the white rectangle. For such a scenario, first a break of the green curve needs to happen, and then the price action around the potential support of the yellow line or the red price levels below should give us bullish signs. The other 2 price levels above are potential resistance levels which need to be pierced.
!: If the yellow arc does not hold and the price doesn't shoot up, carefully watch out for any significant drops below any higher lows that have been formed in the meantime, which will signal a weakness in the potential bullish wave.

Natural gas will go higher!So, we are back with another trend analysis and new support/resistance levels.
We have had a major pullback from our latest resistance level of 3 back to around 2.8~. Which is fine, its natural.
But I still strongly believe in a major bull run and upside in natural gas, which is why I believe we have to go higher, and we will in the last 2 quarters of 2023.
We have resistance level around 3.3~ - this was tested back in October/November 2020 and most recent around January 2023. This is my first target price (TP 1).
What happens after this is hard to guess at this point of time.
Will we have another energy crisis? What about the war in Ukraine and Russia? My best guess is that we will go higher after reaching 3.3 – but only time will tell.
Let me know what you guys think!
Good luck!

Natural GasBreaking out to the upside in a H&S type formation confirmed by system bullish bars. Target $4.10, i.e. just below gap from a few months ago.

Natgas, what do you think?What do you think about this? What will be the market reaction after opening? Personally, I bet on line number 1

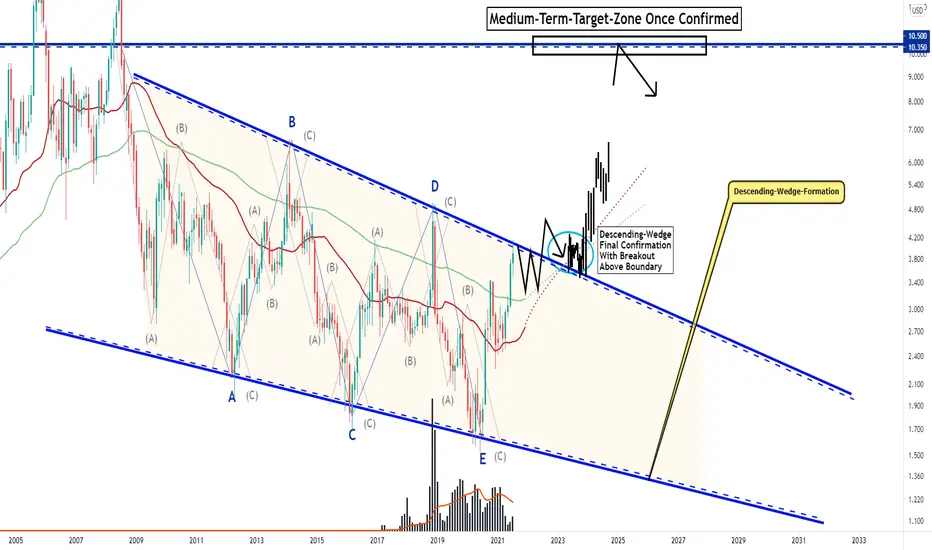
NATURAL GAS, Century Descending-Wedge Breakout Incoming!Hello,
Welcome to this analysis about Natural Gas and the monthly timeframe perspectives. Natural Gas over the last times as I discovered has built a massive formation which will be an important source in the upcoming times and especially when it completes the developments happening after the confirmation will be huge. Besides that, there are also other fundamental factors that play into a potential bullish increase and the developments that can be seen in real price-action. Therefore I am looking at all the important levels and upcoming determinations we should consider with Natural Gas's established structure and the upcoming movements ahead of the next times.
Structural Technical Developments:
As when looking at my chart we can watch there how Natural Gas has formed this major formational structure with several bounces to the upside from the lower supports every time holding these supports and increasing with volatility and volume which is a good sign for stabilization. Furthermore mainly Natural Gas is forming this massive reversal formation, this formation is a descending-wedge-formation which is known as a solid bullish reversal formation. Natural Gas already managed to complete the coherent wave-count from A to E in this formation and is now penetrating the upper boundary of the formation with the recent bullish move. Besides that Natural Gas is now holding above the 35-EMA in red and the 100-EMA in green which it had previously as resistance and is now appropriate support.
Upcoming Perspectives And Fundamentals:
Taking all these factors into the consideration this formation has a good potential to complete in the upcoming times which will happen with a final breakout above the upper boundary, this will complete the formation and will also activate upside targets marked in my chart within the 10 areas. From a fundamental perspective, there is the thing with governments altering the gas price higher with setting taxes and extra fees on the gas because more and more governments looking to increase renewable energies these are measures actively taken by governments to switch from fossil energy to renewable. This is why the actual gas price will go up higher in the next times to come as the regulatory body step by step is setting the price higher which is also corresponding with the technical development suggested, therefore the bullish case has an increased likelihood here, it will be an interesting journey ahead.
In this manner, thank you for watching my update-analysis about NATURAL GAS and the main descending-wedge and its breakout likely to emerge in the upcoming times, great when you support it with a like and follow or comment for more market insight!
"There are many roads to prosperity, but one must be taken."
Information provided is only educational and should not be used to take action in the market.
NATURALGAS - Aggressive Short Term ShortUltimately I am bullish on Natural Gas in higher time frame and so this is quite an aggressive short trade.
But that said it appears quite obviously to have completed AR Automatic Rally as a bearish ascending channel with overlapping highs revealing upside weakness.
This next wave down would complete ST Secondary Test . There is high liquidity below the low @ $2.061 and that will attract price. There is a reasonable that it will print a lower low to tap the liquidity and print ST.
And so a big shakeout dump is probably coming.
Currently it is pressing down on the 50 day MA and will likely fall through soon.
There is a little upper wicked shooting star candle and the selling pressure in that area gives us a clue that upward momentum has been halted and we're close to the next move down.
The star candle allows quite a tight stop loss just above and so margin can be increased for this trade.
3 targets for this trade:
1st target is the 0.618 retracement: 2.393. This is a 2.6:1 RR trade.
2nd target is the 0.786 retracement: 2.241. This is a 4:1 RR trade
3rd target is the low: $2.061. This is a 5.6:1 RR trade.
SL: 2.781
TP1: 2.393
TP2: 2.241
TP3: 2.061
Not advice

Natural Gas - Creeping higherNatural Gas is looking to make its highest weekly close since February, earlier this year.
This would be an extreme bullish shift in the overall Gas market.
If we get a new weekly high close, this will likely trigger some energy funds to start accumulating on the long side.
Inventories tomorrow is going be crucial for the price action. We could see a technical weekly breakout of this basing formation if the builds come in lower than expected.
Unlike the last time in February when we approached these levels we are doing it at a much softer rate of change move, which means there's a high chance that this could be a sustainable breakout.

Long $NATURALGASSeasonal patterns in favor of long, USOIL/NATURALGAS >25, upward channel in Nattygas as well as sudden volatility upwards.

Natural Gas, accumulation ideaWinter is coming and we should not miss some prices. Half an hour ago we got news that the storage was reduced by 10B from the forecast.
For me good price to buy spot 2$-2.22$. This is currently neglected by any chart.
Tell me more about this topic if you have some opinion.

NATGAS LONG TERM TRADE analysiAug 27
Hello Traders
In This Chart NATGAS HOURLY Forex Forecast By FOREX PLANET
today NATGAS analysis 👆
🟢This Chart includes_ (NATGAS market update)
🟢What is The Next Opportunity on NATGAS Market
🟢how to Enter to the Valid Entry With Assurance Profit
This CHART is For Trader's that Want to Improve Their Technical Analysis Skills and Their Trading By Understanding How To Analyze The Market Using Multiple Timeframes and Understanding The Bigger Picture on the Charts

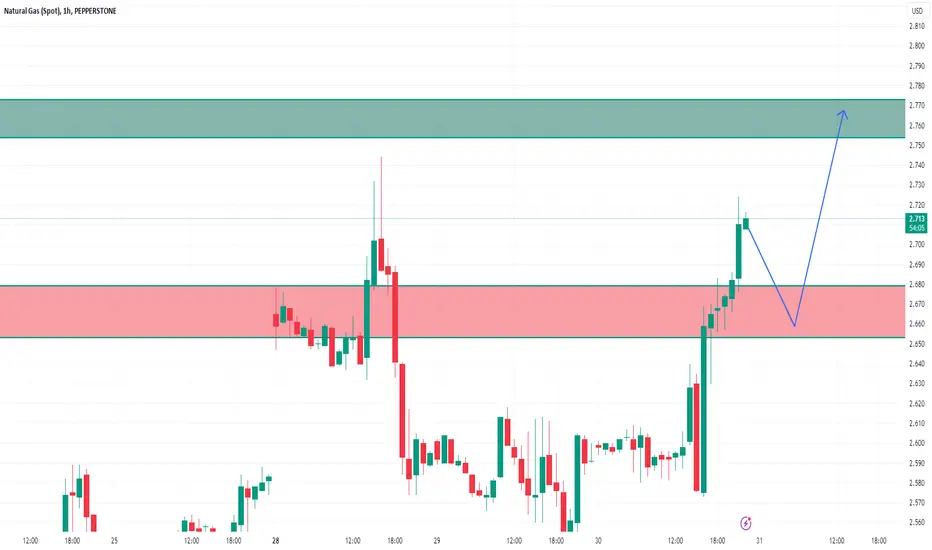
Natural GasAs noted to our members, Natural Gas rejected that 2740 area and is now heading back to retest the 2700 area.
We should see a bounce in this area back up for a longer-term bullish move.
As a scalper, this is an excellent area for a BUY opportunity.
Thoughts?

Natural Gas: Potentila Small Double TopNatural Gas: Potentila Small Double Top
During Friday and the NFP data the price moved down by confirming a small double top
pattern.
However, it is very risky because the speculative volume is very high with NG.
If the price will hold below the neckline of the pattern we may see NG moving down further.
However, this movement was also in line with the bigger picture and the chances are higher that it can move down further.
Thank you and Goo Luck!

Natural Gas: Top Down AnalysisNatural Gas: Top-Down Analysis
In this video, I have shared my opinion on Natural Gas through a top-down analysis.
I explained in detail the possible trading scenarios we may face.
Be careful because Natural Gas is a very risky financial instrument.
Thank you and good luck!

NatGas Hourly View This is a higher timeframe view for the previous post -https://www.tradingview.com/chart/NATGASUSD/gwgRrXus-NatGas-Update/

#NatGas UpdateI reckon we might be witnessing a rise in wave (v) of [i ]. The price is likely to gravitate towards 200 MA which is trending down on Daily timeframe.

Cup&HandleIf it is a true cup and handle then it can push the price up to around2.9 (oanda) area. Specially with a bullish report today...

NATGAS LONG TERM TRADE analysiAug 27
Hello Traders
In This Chart NATGAS HOURLY Forex Forecast By FOREX PLANET
today NATGAS analysis 👆
🟢This Chart includes_ (NATGAS market update)
🟢What is The Next Opportunity on NATGAS Market
🟢how to Enter to the Valid Entry With Assurance Profit
This CHART is For Trader's that Want to Improve Their Technical Analysis Skills and Their Trading By Understanding How To Analyze The Market Using Multiple Timeframes and Understanding The Bigger Picture on the Charts
NATGAS, to target 2.76 on 30-min chartNATGAS
On the 30-min chart, there is 2.70 then 2.76
More targets after crossing 2.76 up to 3.2 , 3.5 in a few weeks
Technical indicators RSI and MACD are positive for the up trend.

xngusd.....DTechnical analysis of gas against the US dollar on the daily time frame.
= The analysis is based on trend analysis and Wyckoff's Laws
= If the price exceeds the downtrend and also exceeds the level of 2.882, then it becomes eligible to rise to the level of 3.693
= If the price exceeded the level of 3.693, it qualifies it to rise to the level of 4.812

NATGAS LONG TERM TRADE analysisHello Traders
In This Chart NATGAS HOURLY Forex Forecast By FOREX PLANET
today NATGAS analysis 👆
🟢This Chart includes_ (NATGAS market update)
🟢What is The Next Opportunity on NATGAS Market
🟢how to Enter to the Valid Entry With Assurance Profit
This CHART is For Trader's that Want to Improve Their Technical Analysis Skills and Their Trading By Understanding How To Analyze The Market Using Multiple Timeframes and Understanding The Bigger Picture on the Charts
