Natgas H&S formingClosing above neckline will generate strong push up. Probably above recent major resistants above 3$
NATURALGASCFD trade ideas

NATGAS BULLISH SETUP LONGNATGAS is making a rebound from the support level of 2.42 so I think that we will see a further move up.

Natural gas- Short Natural gas (spot) is still keeping down trend as it never gives a higher high but lower high.
In a minor trend, it can break a trendline and did a retesting. So, it is possible to go down.
So, we can look for short term trading with short positions.
Good luck.

✅NATGAS BULLISH SETUP|LONG🚀
✅NATGAS is making a rebound
From the support level of 2.42
So I think that we will see
A further move up
LONG🚀
✅Like and subscribe to never miss a new idea!✅

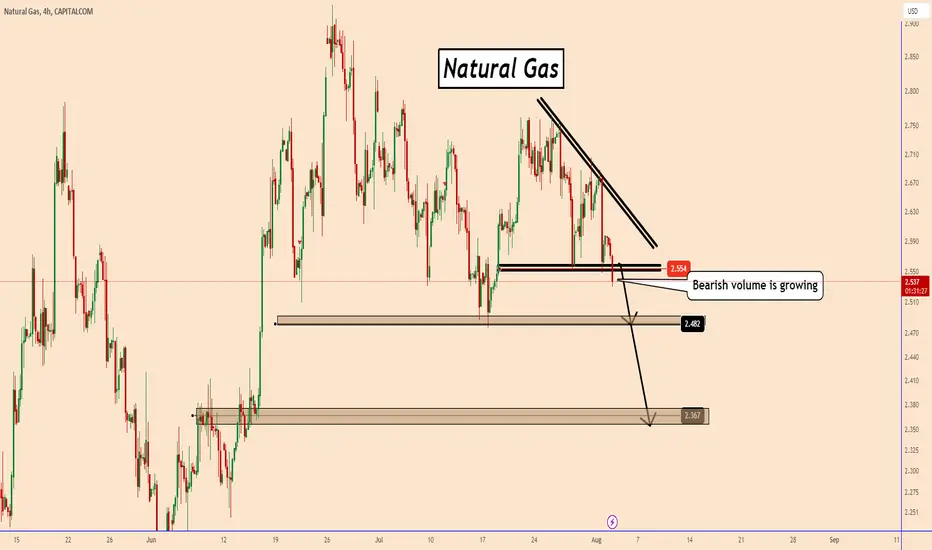
Natural Gas May Test 2.3 During This MonthNatural Gas May Test 2.3 During This Month
After a big corrective pattern where the price spend many days finally we can see NG
moving down again.
NG had a long time that it was not holding very well the bullish volume and a bearish movement was again on the cards.
The price broke below 2.55 today and it is increasing the chances that it can move down further and if all goes fine it may test 2.3 price zone this month.
Thank you and Good Luck!
Buy? or Bye? Still a little bit disappointed that the big move upwards didn't materialize mid July, BUT.. there's still a chance and I think this is a pivotal area.
I'm neautral ATM

NG consolidation and uptrendCan bulls take over the rally?
Disclaimer: I'm not a SEBI registered advisor. All posts are only for educational purposes.

NatGas Bullish WedgeA bullish wedge pattern breakout, which coincides with rising trend line support, has confirmed wedge resistance as new support. At the same time, price has also confirmed rising trend line support for the second time. Both seem to point to more upside. I'm looking for a measured move based on the wedge pattern up to about 3.35.

NATGAS | High RR TradeBought after seeing good reaction to the channel. Would also buy ~2.00$ for the winter.

An alternative view...Could be a measured moved down 🤔 The only thing I'm almost certain of, is no more sideways action...
Personally Sticking with the More Bullish scenario from my previous posts -But this would make sense- throw off a ton of retail longs and get an even better entry price.

Wishful thinking? Or calculated take off?
The reality is friends, nobody knows and if they did I doubt they would tell eveyone on TradingView - BUT... IMO, Out of all the things I'm charting this is the most likely to pop off.
Volatility incoming.
NFA 👍

NATGAS LONG TERM TRADEBUYINGHello Traders
In This Chart NATGAS HOURLY Forex Forecast By FOREX PLANET
today NATGAS analysis 👆
🟢This Chart includes_ (NATGAS market update)
🟢What is The Next Opportunity on NATGAS Market
🟢how to Enter to the Valid Entry With Assurance Profit
This CHART is For Trader's that Want to Improve Their Technical Analysis Skills and Their Trading By Understanding How To Analyze The Market Using Multiple Timeframes and Understanding The Bigger Picture on the Charts

NATGAS Analysis 30July2023This analysis is still with the old analysis. Still in a positive condition bullish. After the price forms a choch structure and corrected, the price is stuck in the Fibo Retracement area 0.382 and is likely to continue bullish up to the right level of Fibo 1,618 in contact with the highest price in March.

Natural Gass MatrixHard to pick the right candles for an entry (price action signals examples highlighted on chart), but sometimes it can be easier with a little help from the matrix. Let's see how this plays out. Looking for patterns near the marked dates (whole day counts) or near the price levels. I also drew two pathways that I would cherry pick from the infinity of potentials. Looks better than it should. This ride might get bumpy. :)

#NatGas Update #OOTTThe chart is non-tradable (though I did enter some cheeky shorts). Natgas is tracing out something really intricate, as is its typical behaviour.
I suspect (and this is only specualation at this point) that the market is undergoing a compex [ w] [ x] [ y] correction as wave b where [ x] is a flat with an expanding diagonal in wave (C).
Then there has to be either another flat or a triangle in wave [ Y] to complete wave b and proceed to a simple impulse c.
That is extremely speculative at this moment, and hence not tradable from an ElliottWave perspective.
The key points are
- I believe the correction within the correction has not yet been completed.
- Once wave b is completed, there may be a nice quick short setup followed by medium-term long opportunity
This is not advise.

Gas ⛽ rejected Perhaps the bullish sentiment with regards to energy is misguided... I still think gas is cheap, but in reality I suppose that a really good thing 👍 the explosive move I was expecting never materialised, so... back to the drawing board for me.

Natural gas bull move!Possible upwards move in Natural Gas as of tomorrow - when we get news about the gas storage.
Possible catalysts:
How weather both in Europe and in USA.
Good luck!

Target 4.97Following daily chart sharing to see it more clear weekly.
We're good to go now
TP1 3.58
Tp2 4.97
Another target will be EMA100 which is on the chart.
SL 2.06 - it's a bit far away SL but technically this is possible.

Next Bullish Action for Natural gasI have been looking at the XNGUSD possible bullish period and my T.A clearly shows it might be in 2024 June or maybe July but this period we should experience a bullish momentum and there are possible chances that will happen with the forth coming election in the United States. Looking at this period (2024) there should be some reduction or cancellation in sanctions by the United states which will Fundamentally have a positive effect to XNG going bullish.
Disclaimer: This is just a technical analysis used to predict the future of natural gas not a medium for anyone to trade. if you choose to BUY now WISE choice but that decision is not by any chance associated to this T.A. GoodLuck

Last post for a while, unless ... I wish trading view supported gifs... If they did, I would insert here Brain blessed form Flash Gordon screaming "FLY Gordon Fly" 🚀🚀🚀
Whether this particular prediction plays out or not doesn't really matter because I'm long since the purple line- this was just about trying to be seen 👀. I really want the chance to work for a big company or entity.. I'm pretty good at seeing things before other people do, so if your reading this and can help please get in touch, I'll be your compass man. 🧭

#NatGas UpdateNatural Gas did not allow me to enter longs as there was no clean set-up around the bottom of what I labelled wave of expanded flat abc. If the price shapes an ending diagonal, this would confirm the expanded flat abc and provide an opportunity to go short. This is not advice.

Well well well...I think it's a measured move.
It's possible. BUT. If it doesn't materialize I will hold my hands up and accept I was wrong at 2200 tomorrow.
@tradingview- if it plays out, surely gotta be worth 10 points 😁

Natural Gas AT BREAKOUTOn natural gas chart, we see a good consolidation at lower level
Now the price pattern show strength in Natural gas
If natural Gas break 2.9 or 3.0
than we can see a good reversal in Natural Gas Chart for atleast 3.5 or 04$ level.
