Natural Gas Wave Analysis – 19 May 2025
- Natural Gas broke support zone
- Likely to fall to support level 240.00
Natural Gas recently broke the support zone between the support level 3.600 (which stopped the previous wave B) and the 50% Fibonacci correction of the previous ABC correction (B) from April.
The breakout of this support zone accelerated the active impulse wave (C) of the primary correction 4 from the start of March.
Natural Gas can be expected to fall to the next support level 3.200, which is the target price for the completion of the active impulse wave (C).
NATURALGASCFD trade ideas

Natural Gas is in the Buying DirectionHello Traders
In This Chart NATGAS HOURLY Forex Forecast By FOREX PLANET
today NATGAS analysis 👆
🟢This Chart includes_ (NATGAS market update)
🟢What is The Next Opportunity on NATGAS Market
🟢how to Enter to the Valid Entry With Assurance Profit
This CHART is For Trader's that Want to Improve Their Technical Analysis Skills and Their Trading By Understanding How To Analyze The Market Using Multiple Timeframes and Understanding The Bigger Picture on the Charts

Natural Gas - Are you buying the dip?Natural gas is going through some distribution and it looks like its going lower.
However there is a very strong base around $3 that can be a good risk to reward buy zone.
Remember this is one of the most volatile asset classes amd can overshoot key levels. Size accordingly and leave yourself maneuverabilty.

XNG/USD Natural Gas Heist: Thief Style Long Entry Plan!🌍 Greetings, global treasure hunters! Ciao! Salaam! Salut! Hola! 🌍
Attention, wealth snatchers and market bandits! 💸🦹♂️
Crafted with the slick Thief Trading Style—a blend of sharp technicals and cunning fundamentals—here’s our blueprint to raid the XNG/USD Natural Gas Energy Market. Follow the chart’s game plan, locked on a long entry. Our mission? Slip out near the perilous YELLOW ATR Zone—a high-stakes trap where overbought vibes, consolidation, or trend flips empower bearish rogues. 🎯💰 “Cash out and spoil yourself, crew—you’ve earned it!” 🥂🚀
Entry 1: “The safe’s cracked! Watch for the MA breakout at 3.750, then pounce—bullish loot awaits!”
Hot tip: Set buy stop orders above the Moving Average or place buy limit orders at the latest 15/30-min swing low/high for pullback plays. 📣 Add a chart alert to nab the breakout!
Entry 2: “The caper’s live! Lurk for the MA pullback in the Grand Heist Zone at 3.300, then strike—fortune favors the bold!”
Stop Loss 🛑: “📢 Yo, crew, hear me out! 🗣️ If you’re jumping in with buy stop or limit orders, don’t set that stop loss until the breakout pops off. 💥 Play it safe and place it where I mark 📍, or go rogue if you’re feeling wild 😎—but don’t blame me if the market bites! ⚡ Your risk, your call.”
📍 Thief SL set at the nearest 4H swing low (3.400) or Grand Heist Zone SL at (3.100) for swing trades.
📍 Adjust SL based on your trade risk, lot size, and multi-order strategy.
Target 🎯: 4.220—or ghost out early if the vibe shifts.
🧲 Scalpers, eyes up! 👀 Stick to long-side scalps. Got deep pockets? Dive in now. Otherwise, join the swing traders for the big heist. Use trailing SL to lock in your haul. 💵
⛽ XNG/USD Natural Gas is buzzing with bullish heat, fueled by key drivers. ☝📰 Dig into Fundamentals, Macro Trends, COT Reports, Inventory Data, Seasonal Patterns, Sentiment Vibes, Intermarket Insights, and Future Targets. Check the full scoop here 👉🔗
⚠️ Heist Alert: News & Position Defense 🗞️🚨
News drops can shake the market like a getaway chase. To protect your stash:
Skip new trades during news hours.
Use trailing stops to guard profits and secure your escape.
💎 Back our heist crew! 💥 Smash that Boost Button 💥 to fuel our money-grabbing spree. Join the Thief Trading Style squad and swipe profits daily with swagger. 🏆🤝🎉
Catch you at the next caper—stay sharp, bandits! 🤑😼🚀

SHORT NATURAL GAS ON M30Price entered a Resistance+ a Supply zone on D1, it got rejected making a lower high and now it closed on M30 below previous low.My TP zone it aligns perfectly with a weekly demand zone around 3.38 + 0.618 FIB from previous low at 2.9990, however I am closely watching few H4 Demand levels along the way and see how price will react there. The first H4 demand zone I am watching is 3.62-3.55 and the second one is 3.52-3.48.
Trade smart, be kind and stay strong
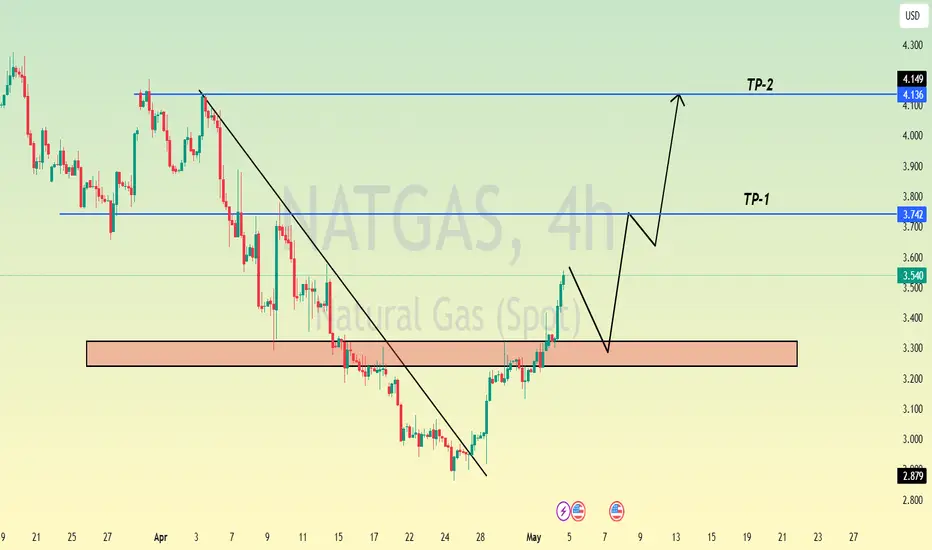
Natural Gas: Bullish Triangle PatternNatural Gas: Bullish Triangle Pattern
Natural Gas (XNGUSD) appears to be forming a Bullish Triangle Pattern, suggesting potential upward movement. The price is currently around 3.9900 USD, and the analysis highlights two key targets:
The breakout from the triangle pattern indicates possible price strength, meaning buyers are gaining control.
The structure suggests that the breakout from the pattern is acting as support, while 4.1000 USD and 4.2000 USD are key resistance zones where price action may face resistance.
While the price may continue rising toward the targets, minor corrections could occur along the way as traders take profits or reassess market conditions.
First target: 4.1000
Second target: 4.2000
You may find more details in the chart!
Thank you and Good Luck!
❤️PS: Please support with a like or comment if you find this analysis useful for your trading day❤️

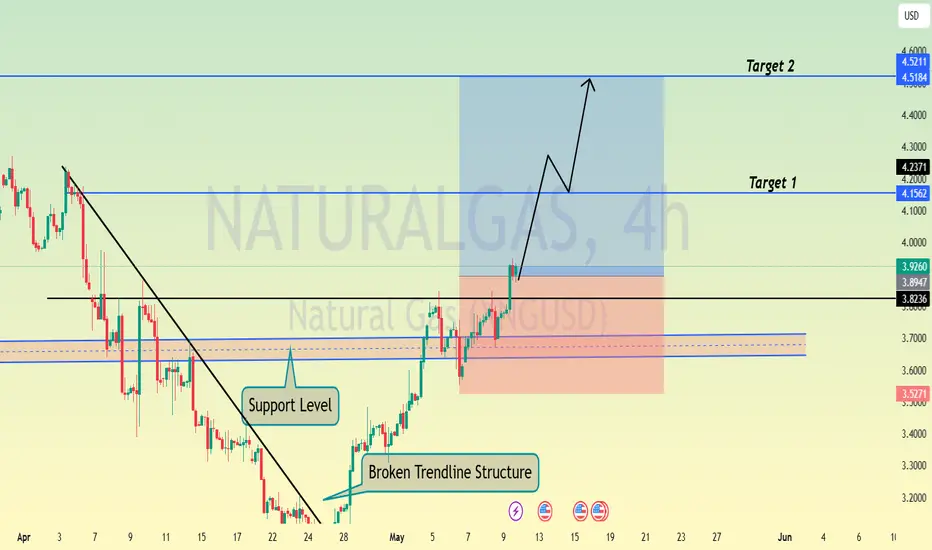
Natural Gas is in the Buying Direction After Trendline Breakout Hello Traders
In This Chart NATGAS HOURLY Forex Forecast By FOREX PLANET
today NATGAS analysis 👆
🟢This Chart includes_ (NATGAS market update)
🟢What is The Next Opportunity on NATGAS Market
🟢how to Enter to the Valid Entry With Assurance Profit
This CHART is For Trader's that Want to Improve Their Technical Analysis Skills and Their Trading By Understanding How To Analyze The Market Using Multiple Timeframes and Understanding The Bigger Picture on the Charts
NaturalGas BUYNatural Gas (Henry Hub) Forecast for May 8–15, 2025
1️⃣ Expected Storage Report (EIA, May 9)
An inventory increase of 95–105 Bcf is expected. This is slightly above average but considered acceptable by the market.
If the build is below 95 Bcf — prices may accelerate upward. Above 105 Bcf — a short-term correction is possible.
2️⃣ Storage levels (EIA)
4–5% below the 5-year average, creating a moderately bullish backdrop.
3️⃣ End-of-season storage forecast
A 3% deficit below the 5-year norm is projected.
4️⃣ Production
High (105 Bcf/day), remains the main bearish factor.
5️⃣ LNG Exports
At record levels, supporting demand and prices.
6️⃣ Weather
Warm, increasing cooling demand.
7️⃣ COT (trader positions)
Short positions are decreasing, long positions increasing — a moderately bullish signal.
8️⃣ Technical Analysis
Price holds above the 200-day EMA. Key support at $3.50, resistance at $3.85–$4.00.
9️⃣ Candlestick Analysis (daily chart)
A bullish candle with a long body confirms buyer control.
🔟 Market Sentiment
Buyers remain active, funds cautiously adding long positions.
2-hour chart
A bullish flag pattern remains intact.
5-minute chart
The uptrend continues with higher highs and higher lows.
Conclusion:
The market shows a moderately bullish trend.
Expected price range for next week — $3.65–$3.90, with potential to test $4.00.
Chance of a drop below $3.40 is minimal (≤30%).

Natural Gas (Henry Hub) – Intraday Outlook | May 5, 2025I'm closely watching the 3.5341 level — it's the high of the bar with the highest volume traded recently, making it a significant area of interest. If price returns to this level, it may act as a potential pivot point for a long setup.
📈 Bullish Scenario:
If price reacts positively from 3.5341, confirming buyer presence, I will consider long entries from this level with the following targets:
🎯 Long Targets:
Target 1: 3.7396
Target 2: 3.8153
📉 Bearish Scenario:
If price breaks below 3.5341 and shows weakness on the retest, I’ll look for a short setup from that level.
🎯 Short Target:
3.4052
#TechnicalAnalysis #DayTrading #VSA #NG #HenryHub #NaturalGas #FuturesTrading #VolumeSpreadAnalysis

Natural Gas: Bearish Setup with Cautious PositioningFurther upward movement in natural gas is limited. The trend remains bearish.
The only thing that holds me back from opening a short position is the need for a wide stop above the 3.85 high, which is nearly 4.5%. The downside target is at least the $3 level, potentially down to $2.60.
Everything looks good, but the stop is very wide.
That’s why I’m starting with a small position size and will add more as the idea plays out .

NG LONGWithout getting much into fundamentals I am expecting a retrace before start of another rally as ng has more to go to reach $3.45.. Aim is for $4.2 (we have different brokers that may give price inconsistency chart wise). Becareful cuz tomorrow we have report at 3:30 and around the time when report is out theres a good chance for a fake out to trap the sellers as there could be a liquidity war.

I want to SELL but you want to BUY? That's trading!!!!All the information you need to find a high probability trade are in front of you on the charts so build your trading decisions on 'the facts' of the chart NOT what you think or what you want to happen or even what you heard will happen. If you have enough facts telling you to trade in a certain direction and therefore enough confluence to take a trade, then this is how you will gain consistency in you trading and build confidence. Check out my trade idea!!
www.tradingview.com

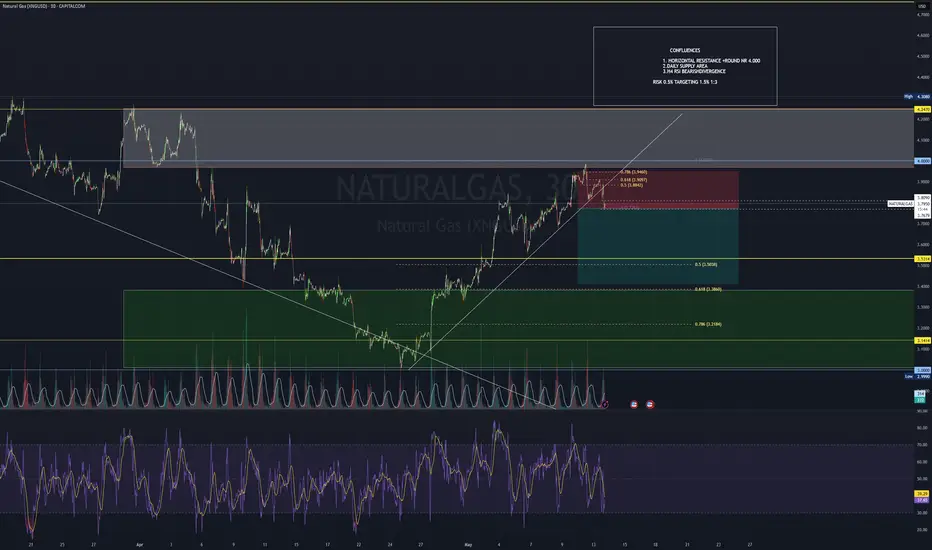
NATAGAS - RSI Divergence - ShortNATAGAS - RSI Divergence - Short
Potential opportunity for this trade

XNG/USD "Natural Gas" Energy Market Robbery (Bullish Plan)🌟Hi! Hola! Ola! Bonjour! Hallo! Marhaba!🌟
Dear Money Makers & Robbers, 🤑 💰💸✈️
Based on 🔥Thief Trading style technical and fundamental analysis🔥, here is our master plan to heist the XNG/USD "Natural Gas" Energy Market. Please adhere to the strategy I've outlined in the chart, which emphasizes long entry. Our aim is to escape near the high-risk ATR Zone. Risky level, overbought market, consolidation, trend reversal, trap at the level where traders and bearish robbers are stronger. 🏆💸"Take profit and treat yourself, traders. You deserve it!💪🏆🎉
Entry 📈 : "The heist is on! Wait for the MA breakout (3.700) then make your move - Bullish profits await!"
however I advise to Place Buy stop orders above the Moving average (or) Place buy limit orders within a 15 or 30 minute timeframe most recent or swing, low or high level for Pullback entries.
📌I strongly advise you to set an "alert (Alarm)" on your chart so you can see when the breakout entry occurs.
Stop Loss 🛑: "🔊 Yo, listen up! 🗣️ If you're lookin' to get in on a buy stop order, don't even think about settin' that stop loss till after the breakout 🚀. You feel me? Now, if you're smart, you'll place that stop loss where I told you to 📍, but if you're a rebel, you can put it wherever you like 🤪 - just don't say I didn't warn you ⚠️. You're playin' with fire 🔥, and it's your risk, not mine 👊."
📍 Thief SL placed at the recent/swing low level Using the 4H timeframe (3.300) Day/Swing trade basis.
📍 SL is based on your risk of the trade, lot size and how many multiple orders you have to take.
🏴☠️Target 🎯: 4.200 (or) Escape Before the Target
🧲Scalpers, take note 👀 : only scalp on the Long side. If you have a lot of money, you can go straight away; if not, you can join swing traders and carry out the robbery plan. Use trailing SL to safeguard your money 💰.
💨⛽XNG/USD "Natural Gas" Energy Market Heist Plan (Swing / Day Trade) is currently experiencing a bearishness,., driven by several key factors.
📰🗞️Get & Read the Fundamental, Macro, COT Report, Inventory and Storage Analysis, Seasonal Factors, Sentimental Outlook, Intermarket Analysis, Future trend targets.. go ahead to check 👉👉👉🔗🔗🌎🌏🗺
⚠️Trading Alert : News Releases and Position Management 📰 🗞️ 🚫🚏
As a reminder, news releases can have a significant impact on market prices and volatility. To minimize potential losses and protect your running positions,
we recommend the following:
Avoid taking new trades during news releases
Use trailing stop-loss orders to protect your running positions and lock in profits
💖Supporting our robbery plan 💥Hit the Boost Button💥 will enable us to effortlessly make and steal money 💰💵. Boost the strength of our robbery team. Every day in this market make money with ease by using the Thief Trading Style.🏆💪🤝❤️🎉🚀
I'll see you soon with another heist plan, so stay tuned 🤑🐱👤🤗🤩

Bullfinder's Breakout Commodities - Natural GasWelcome to Bullfinder's Breakout Commodities - Commodities with breakout potential.
In this edition, we'll be looking at PEPPERSTONE:NATGAS ...
Our Team has identified that this code is at a point of particular interest & potential volatility.
After re-rating Natural Gas's momentum to Bullish on the 26th of Nov 2024, our Team has again set eyes on the commodity, noting the following important reference point...
If price can hold above $2.950 ... Significant Bullish potential may be unlocked.
If however price falls below $2.950 ... Significant Bearish risk may come into play.
We're inspired to bring you the latest developments across worldwide markets, helping you look in the right place, at the right time.
Thank you for reading! Stay tuned for further updates, and we look forward to being of service along your trading & investing journey...
Disclaimer: Please note all information contained within this post and all other Bullfinder-official Tradingview content is strictly for informational purposes only and is not intended to be investment advice. Please DYOR & Consult your licensed financial advisors before acting on any information contained within this post, or any other Bullfinder-official TV content.

Natural Gas: Watching for a Break Above 3.40 to Re-Enter LongOverall, I remain bullish on natural gas, as I mentioned yesterday, and even entered a position.
However, I didn’t hold through the entire move. There are definitely some issues with overtrading that I need to work on.
At the moment, I’m out of the market and considering a re-entry only if yesterday’s high at 3.39 is broken.
If the price moves above 3.40, I plan to re-enter the position, targeting the 3.60 level.

Natural Gas is in the Buying DirectionHello Traders
In This Chart NATGAS HOURLY Forex Forecast By FOREX PLANET
today NATGAS analysis 👆
🟢This Chart includes_ (NATGAS market update)
🟢What is The Next Opportunity on NATGAS Market
🟢how to Enter to the Valid Entry With Assurance Profit
This CHART is For Trader's that Want to Improve Their Technical Analysis Skills and Their Trading By Understanding How To Analyze The Market Using Multiple Timeframes and Understanding The Bigger Picture on the Charts
Trend Reversal With Low Demand Natural Gas Outlook: Bearish signals dominate NATGAS with a Head & Shoulders pattern, Shooting Star, and Bearish Engulfing on the chart.
Technical Indicators: RSI is declining, and MACD shows bearish momentum, supporting further downside.
Weather Impact: The UK forecast for the next two weeks shows mixed conditions—initial sunshine but turning unsettled with rain and wind.
Heating Demand: Temperatures will range between 2°C and 13°C, potentially affecting natural gas consumption.
March 28-31: Breezy conditions with low clouds and occasional showers, possibly moderating demand.
Market Reaction: UK NATGAS price projections show stability around 58.2 on March 28 and 57.7 on March 31.
Key Resistance & Support: Watch $4.00 resistance and $3.60 support for potential breakouts.
Bearish Confirmation: If price closes below $3.80, further downside towards $3.50 could be expected.
Fundamental Factors: Geopolitics and supply dynamics still play a major role in volatility.
Risk Management: Monitor weather updates and gas storage reports for potential reversals.
Short-Term Traders: Bearish entries could target $3.60 with tight stop losses above $4.00.
Long-Term Investors: May look for buying opportunities near strong support zones.
Caution: Unexpected cold snaps or supply disruptions could invalidate bearish scenarios.
Stay Updated: Keep track of weather forecasts and fundamental changes impacting demand/supply.
Not Financial Advice: Do your own research before trading.


Natural Gas: Right Shoulder Formation Before Next Sell Order.Our previous analysis accurately predicted the gas market sell-off, allowing us to align with sellers and identify the neckline of a significant head and shoulders pattern.
Now, we're tracking a potential buying opportunity, anticipating the completion of the pattern's right shoulder.
Join us as we target defined profit objectives #1 and #2.
Once these targets are achieved, we'll be ready to shift gears and realign with sellers, maximizing your portfolio's performance through Candlestick Pattern analysis and proactive positioning.

Weekly chart says it want to skyrocket Weekly chart says it want to skyrocket .
As it's weekly chart 10-15% dip still cannot be denied .
I am expecting minimum $6 as primary target.

Natural Gas (Henry Hub) – Intraday Outlook | May 1, 2025The previous idea played out well — price hit the first long target cleanly and came just short of the second target, which was 3.4501
📍 Current outlook:
I've updated the ascending channel based on the new pivot points.
If we see a strong buy reaction from the 3.3575 level, I’ll expect to complete the move to 3.4501, and the next goal will be the upper boundary of the channel.
However, if price closes below 3.3585, we may be seeing the beginning of a range formation, with downside potential toward the 3.2556 support zone.
#TechnicalAnalysis #DayTrading #VSA #NG #HenryHub #NaturalGas #FuturesTrading #VolumeSpreadAnalysis

Double Top, Beginning of down trend into the $2'sDouble Top, Beginning of down trend into the $2's.
Targeting $2.8
Looking for a move to $2 and $1.8 later in the year due to bearish fundamentals.
