Bullish SituationIn the weekly timeframe, NEAR has successfully broken through its key resistance level. This breakout, which is visible on the chart, indicates the potential for price growth. If Near can sustainably maintain its price above this resistance level, we anticipate an increase in its price.
NEARUSDT trade ideas

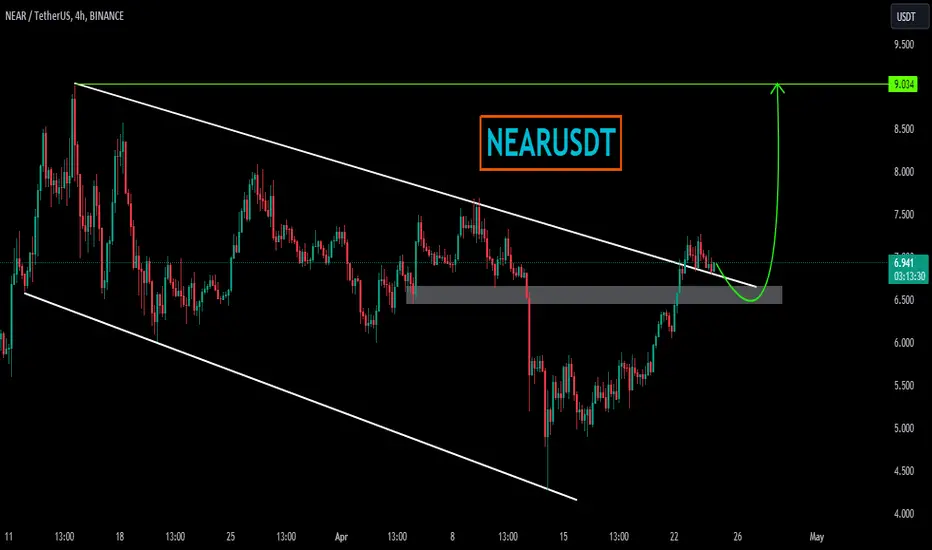
#near/usdt is experiencing a breakout👀 The potential target fo#near/usdt is experiencing a breakout👀
The potential target for price, in case of a successful breakout, is at $9🎯
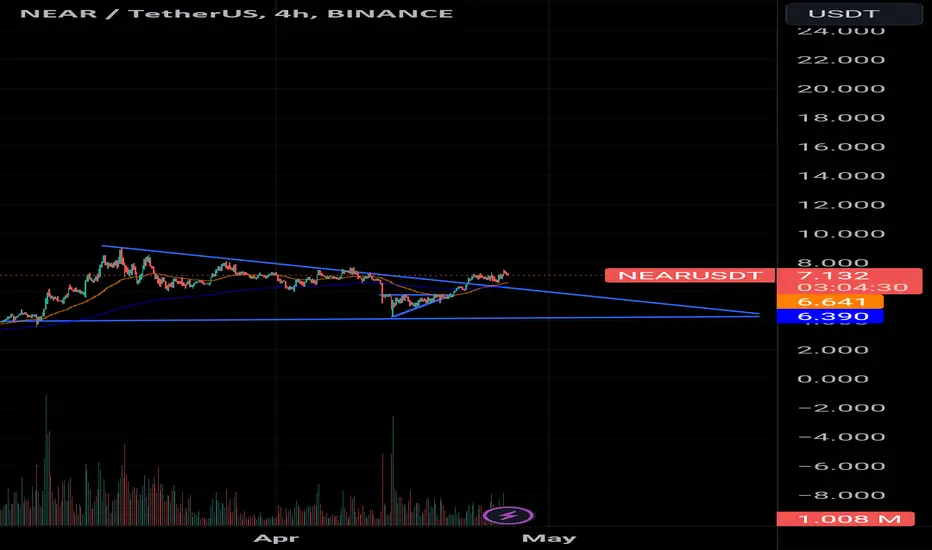
Potential Short Scenario for NEAR/USDT: Key Level BreakdNEAR/USDT has been experiencing a significant uptrend over the past few weeks, but recent price action suggests a potential reversal might be on the horizon. A key support level has emerged, and a breakdown below this level could signal further downside momentum.
A breakdown below this level could unleash additional downside potential, offering short trading opportunities for savvy traders. However, always remember to conduct thorough analysis and exercise proper risk management to navigate the volatile cryptocurrency markets effectively.

NEAR/USDT, Continuation Pattern shows a potential upwardSupport is identified at the 6.6 USDT price level. The breakout from the significant chart pattern is currently manifesting as a bullish flag pattern. The anticipated target price stands at 9.4 USDT.

Market Review 25.04Review after correction BINANCE:ETHUSDT.P BINANCE:DOGEUSDT.P BINANCE:NEARUSDT.P BINANCE:DOTUSDT.P BINANCE:SOLUSDT.P

NEARUSDTNEARUSDT was trading under the declining trendline. The price was reacting well the support and resistance of trendline
Currently the price has given the breakout from declining trendline with confluence to strong bullish divergence and now seems like the bulls are getting ready for some strong upside movement.
If the bulls sustain to upside the optimum target could be 9.5
What you guys think of this idea?
Bullish continuationDesciption chart setup:
- Possible short formed W (RSI trendbreak confirmed 4h)
- Descending triangle formation for a possible wave 4 (Retracement fib target reached 0.382)
- Target box laid out in chart

Daily trading plan for BTC,SOL,RUNE,NEAR 24/04/2024Please view and comment on daily trading plan for BTC,SOL,RUNE and NEAR
This are not trading patterns but rather trading strategies


NEAR/USDT Break of the bullish flag! Bullish momentum for NEAR.💎 Paradisers, the recent market dynamics surrounding #NEAR have indeed been noteworthy.
💎 Currently, NEAR has successfully broken out of a bullish flag pattern, signaling a potential continuation of the upward trend. Additionally, the MACD indicator has shown a golden cross, further supporting the notion of a bullish reversal.
💎 As NEAR moves forward, it may encounter initial resistance around the $6.35 to $6.5 area, where it could pause for a retest before resuming its upward trajectory.
💎 This retest phase is common after a breakout and provides an opportunity for confirmation of bullish momentum. If NEAR successfully holds above this support and continues its ascent, the next target for the price could be the resistance area outlined in our target zone.
💎 However, if NEAR fails to find support during the retest and breaks below the $6.3 area, it could signal weakness in the bullish trend. In such a scenario, the price may decline further toward the next significant support level around $4.6.
💎 Considering NEAR's past price behavior, it has exhibited resilience by bouncing decisively from the $4.6 support area. Should history repeat itself, NEAR may experience a strong bounce from this level, potentially reclaiming the $6.3 support area and progressing toward our target.
💎 Nevertheless, if NEAR fails to bounce convincingly from the $4.6 support and displays weakening volume, it could signify a breakdown in bullish momentum. A decisive close below the support area would raise concerns about the bullish thesis and could lead to further bearish movement.
MyCryptoParadise
iFeel the success🌴

#NEAR Really good Spot Opportunity#NEAR Really good Spot Opportunity
Waiting for breakout of trendline.
After breakout and retest I will buy on the spot

#NEAR/USDT has broken out of a descending triangle pattern with #NEAR/USDT has broken out of a descending triangle pattern with strong volume, surpassing the 100 moving average, while the Ichimoku cloud signals a bullish trend🧐
A continuation of the bullish move is expected as long as AMEX:NEAR trades above the former triangle resistance☝️

NEARUSD 12HNEAR ~ 12H 📈
#NEAR On the 12H Time Frame, BINANCE:NEARUSDT Formed a Bull Flag Pattern. Bullish if #NEARUSD succeeds in breaking this resistance line with a full body candle. Minimum target 15%+

NEAEUSDT.1DAnalyzing the daily chart for NEAR Protocol (NEAR/USDT), it appears to be in a consolidation phase within a defined range. The price is currently near $7.002, with a key resistance level (R1) at $8.111, which aligns with the previous high. A breakout above this level could signal a bullish trend continuation towards the high of $9.10.
The support level (S1) at $6.062 is a critical zone that has been tested multiple times, suggesting it's a strong level that bulls are defending. The RSI is relatively neutral at 57.75, giving no clear overbought or oversold signals. Meanwhile, the MACD is slightly above the signal line, suggesting some bullish momentum, though it's not strongly definitive.
For trading, a break above R1 could offer a long entry point, with a potential target at the previous high, using a stop loss below S1. Conversely, if the price breaks below S1, it may indicate a shift in sentiment, potentially leading to a sell-off. As always, confirmation from volume and other indicators would provide additional confidence in the trade setup.

NEAR Protocol Price Prediction: Bullish115% or Bearish 44% ?!NEAR Protocol is currently trading within an ascending channel, with clear reactions to the channel's support, resistance, and midline.
Based on current market conditions, our first expectation is for NEAR to break above the $6.037 resistance level and continue its upward trajectory, supported by the $5 level. This could lead to price targets of $7.4, $8.9, and ultimately $13.
However, a bearish scenario could also unfold if the channel's support is broken and the $5 level fails to hold. In this case, NEAR could experience a downward movement towards the $3 level.
Which scenario do you favor?

I Cannot SHORT This !!! Break of Ascending Triangle. Now volume growing as well. Above strong support zone.Chart looks bullish for it. Worth buy for short term quick profits too.

Wanna Double Again? -NEAR PROTOCOL- I recently Shared NearBTC and gave you some short term targets for Near.
In a few week Near will climb through 16 to 20.
According to Elliot waves theory, Near has finished its own corrective move.
It's time for a bull run now.
Targets specified on the chart before this post.
Main target 16.
Good Luck To Us All.

#NEAR/USDT ANALYSIS NEAR is moving in an ascending triangle on#NEAR/USDT ANALYSIS
NEAR is moving in an ascending triangle on the 1-hour timeframe. Currently, it is encountering horizontal resistance, where the MA 200 is also acting as a resistance. The MACD crossover indicates bullish momentum. We need to wait for a solid breakout or breakdown of the triangle to confirm its next direction.


Role of Bearish CandlesThe price of NEAR has managed to break through a significant resistance observed at the last peak of the downward trend, entering an upward trend phase.
By reaching a specific area marked in green, not only has this level been breached, but it seems that the price is stabilizing at this new level.
The existing bearish candles, which are considered a pullback, will likely pave the way for the formation of stronger bullish patterns. If this scenario materializes, it is expected that the price will rise again, reach the orange resistance box, and possibly break through it.

NEAR: More Price Decline is ExpectedNEAR: More Price Decline is Expected
Technical Analysis:
In the daily chart the price broke out from a key support area.
This was the first important confirmation for the bears to join the party.
We can see NEAR testing the broken support zone 5.98 - 6.30 which is turned in a key resistance zone.
The bearish volume should increase more once the price will be near the zone.
Strong support / Target zone is expected near 4.38 , 3.58 and 2.78
You may find more details in the chart!
Thank you and Good Luck!
❤️PS: Please support with a like or comment if you find this analysis useful for your trading day❤️

NEAR-USDT | 4H | TECHNICAL CHARTHello traders, BINANCE:NEARUSDT I have determined the formation target on the chart. I wish everyone success.
Like and comment if you find value in our analysis.
Feel free to post your ideas and questions at the comments section.
NOTE: If my posts don't get likes, don't expect analysis or updates from me.
Good luck

NEARUSDT Zoom out Zoom out and you will not be shaken.
Do not use more than 3x leverage in moments of volatility.
These last events will ultimately benefit us
