Near/Usdt Plan The NEAR/USD price is currently breaking out of the trendline resistance on the 4-hour time-frame. In the event of a successful breakout, I anticipate a significant bullish movement happening soon. Please note that this is not financial advice, so make sure to do your own research (DYOR) before making any investment decisions.
NEARUSDT trade ideas

Near near term. Fibonacci extension levels.Fibonacci extension levels.
There may be a last drop, but i think the rise will continue afterwards.
* What i share here is not an investment advice. Please do your own research before investing in any digital asset.
* Never take my personal opinions as investment advice, you may lose all your money.

NEARUSDT 3DConsider buying some #NEAR here. It has tested the support zone and bounced back. My targets are:
$7.348
$7.885
$9.052
$9.996
$10.940
$11.837
Support zone: $5.998 ~ $6.240

NEARUSDT / Short / 27,04% (4x Leverage) / DT failing supportStrategy: Short
Entry: 6,74600
TP: 6,29000 (6,76%)
SL: 6,97500 (3,39%)
Decision Making process:
Subtle RSI bearish divergence
EMA crossover
Double Top bouncing off resistance and failing support
Support retested
General (BTC) bearish market


🚀📈 NEAR Support Breakout Trade Setup 📈🚀📊 Analysis:
Strong Support: NEAR has rebounded from the support level at $6.43, indicating strength in this area.
Confirmation Needed: Conviction will increase with a clear break above $6.80 and sustained holding above this level.
Laddering Strategy: Plan to enter the trade gradually, starting with minimal leverage and increasing as key resistance levels are surpassed.
📈 Trade Plan:
Entry: Initiate laddered positions once NEAR breaks and holds above $6.80.
Target: Aim for a target of up to $8.80, with potential for further upside.
Risk Management: Start with minimal leverage and increase gradually as NEAR surpasses crucial levels. Set stop-loss orders to manage risk effectively.
💡 Note: Monitor price action closely for confirmation of bullish momentum and adjust strategy accordingly. 📈💰 #NEAR #SupportBreakout 🚀📉

Your Near/usdt entry point opportunity incase you missed Took the first entry but didn't close
Am still holding... But am adding to this position KUCOIN:NEARUSDT

Near 10 Percent gainNear chart analysis was shared yesterday and today its in 10% gains after hitting entery zone. I am expecting more this as clear bos has been done.

NEARUSDT- Bearish outlookThe crypto pair NEAR is making LH and LL forming a bearish trend. The crypto have given fakeout along the way but look like the bull are not ready to charge. The pair made a bearish divergence along with a bearish engulfing, showing confluence near its recent High. Trade setup is a sell opportunity with Entry price, SL and TP mentioned.

Finally Near Preparing For Bullish Wave Towards 10$crypto market is in uptrend and its easier to find entries with trend
seems like near is getting ready for another breakout consolidating in bullish pennant and expecting upside breakout incase breakout expecting solid bullish wave towards 10$

Nearusdt AnlysisNear usdt is in up trend as per the rsi momentum indicator and also the fib retacement show the uptrend

$NEAR #NearProtocol Trading IdeaNEAR/USD (NearProtocol) formed another bull flag/pennant on the daily timeframe for another potential leg up. Full send after a breakout but if we break below this red neckline we can also retest $4.645.

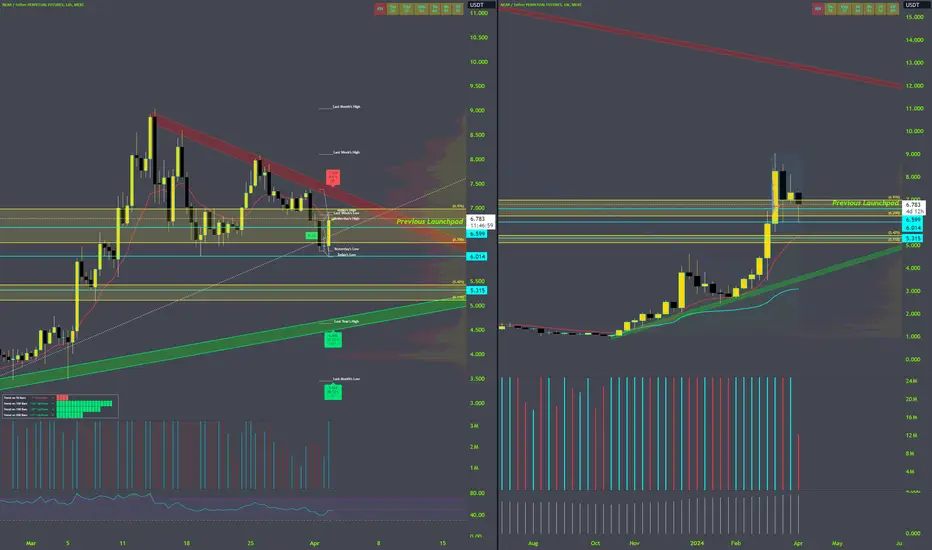
Fueling on the LaunchpadLong story short - last time we were fiddling around with this level, NEAR rocketed to $20.
Now we are forming more support here and around this level....possibly fueling for a nice move higher. We have a few levels of support right below current price action, but my next trend line support is 33% away. I dont really wanna see the 12h structure break downward. 33% is alot, and I personally tend to miss the shorts more often than the longs. Because thats a great short.
[NEARUSDT] - on the verge of breakoutthe falling wedge pattern in consolidation in daily chart.
in the green circle that i highlighte u can see the price action in fibbonaci levels.
always breakout with huge green candle... that happen twice in (0.5 ,0.618).
now we waiting for a breakout the upper side of falling wedge...that will make our next target is 10$
Thank you, and for more ideas, hit "Like" and "Follow"!🎯

Near a clean setupNear has shifted its bearish structure into bullish so I am looking for long oppertunity in marked OB+FVG+SSL area. A very clean chart.

NEAR/USDT LONG SETUP Hello traders. I am here for analysis near/usdt chart for better understanding
So after downward movement now strocture shifting to up ward
I think 7$ level we can enter for buy if confirmed
Yellow zone is the most secure zone for buy position with small stoploss
It located in .78 fib level


NEARUSDT LONG OUTLOOKHello Traders, this is outlook that i think might be work. All Entry, Stop Loss, and Take Profit its already showed up. All trade it is on yourself. DYOR.

The chart says it all, no need to explain!!
NearUSDT is in an uptrend within a triangle channel and on the weekly chart
Trade now or wait for a pullback at $6.9

NEAR can ascend further!Hi
BINANCE:NEARUSDT
Today, I want to analyze NEAR for you in a weekly time frame so that we can have a mid-term view of NEAR regarding the technical analysis. (Please ✌️respectfully✌️share if you have a different opinion from me or other analysts).
NEAR formed a rounding bottom on weekly timeframe🤔
Up we go if we do breakout
✅ Due to the Ascending structure of the chart...
- High potential areas are clear in the chart.
- AB=CD
- Rounding Bottom
Stay awesome my friends.
_ _ _ _ _ _ _ _ _ _ _ _ _ _ _ _ _ _ _ _ _ _ _ _ _ _ _ _ _ _ _ _ _
✅Thank you, and for more ideas, hit ❤️Like❤️ and 🌟Follow🌟!
⚠️Things can change...
The markets are always changing and even with all these signals, the market changes tend to be strong and fast!!

$NEAR Bullish OutlookNEAR is on the verge of a breakout on both the 1d and 4h chart.
The reason I’m bullish is as you can see on the chart, it has been testing the upper trend line of the Symmetrical Triangle formation repeatedly without shooting back down to support immediately which is a good sign of bullish buying.
I would wait for a breakout confirmation on the 4hr (1-3 candle closes above resistance line) and enter a long position no more than 5x (personal preference and risk tolerance)
DYOR/NFA

NEAR (Y24.P1.Video1). RAnging but bullishHi Traders,
My thought for #NEAR #crypto are bullish and I see this as an entry for potential another attempt to break the trending resistance.
We plan and we implement.
All the best,
S.SAri

Near/Usdt Plan Near/USDT has recently experienced a breakout from a triangle pattern on the 4-hour time frame. This breakout has already been confirmed, and the retest of the breakout level seems to be nearly completed. As a result, there is an expectation of a 20-40% bullish move in the short term for Near/USDT.
Please note that the information provided is for educational purposes only and should not be considered as financial advice. It is essential to conduct your research (DYOR) before making any investment decisions.
