TradeCityPro | NEAR: Key Support Battle in Layer 1 AI Protocol👋 Welcome to TradeCity Pro!
In this analysis, I’m going to review the NEAR coin for you — one of the prominent AI-focused and Layer 1 protocols that has gained significant attention in recent years.
🔍 This project’s coin, with the ticker NEAR, currently holds a market cap of $2.94 billion, ranking 34th on CoinMarketCap.
📅 Daily Timeframe
As you can see in the daily timeframe, there is a very strong support level at 2.239, which has been tested multiple times. The price has once again reached this zone.
✨ If this level breaks, the price could drop toward lower supports such as 1.694. Therefore, a break below 2.239 would be a valid trigger for a short position.
💫 The trendline drawn on the chart is also a significant level. If 2.239 is broken, price could potentially react to this trendline as well.
💥 If price holds this support and attempts a bullish move, we can open a long position upon breaking 2.653.
📈 The main long triggers, including potential spot buying, are at 3.355 and 3.548. If these levels are broken, NEAR could begin a strong uptrend toward targets at 4.726 and 7.998.
📊 Currently, market volume is ranging — buyers and sellers are evenly matched. We need to wait and see which side gains dominance to follow the momentum.
✔️ On the RSI oscillator, entering the Oversold zone would confirm a short setup, while breaking above the 50 RSI level would confirm a long setup.
📝 Final Thoughts
This analysis reflects our opinions and is not financial advice.
Share your thoughts in the comments, and don’t forget to share this analysis with your friends! ❤️
NEARUSDT trade ideas

NEAR Protocol Can Hit $35 or $52 in 2025 (PP: 2,000%+)Back to what I was doing... NEAR Protocol (NEARUSDT) closed red three weeks and this week is the fourth week with the action being bearish, why am I bullish?
Four weeks of bearish action and there isn't much, well, bearish action. Total drop is less than 30%. If you look back to January, or say May 2022, four weeks red would be something completely different; market conditions are not the same.
The market now is not bearish nor crashing so we are only seeing a retrace, a retrace is a small correction that ends in a higher low. Wait, let me make a long story short, NEAR Protocol is set to grow.
The market bottom in October 2023 is much, much lower compared to the low hit April 2025, much lower. So we have a very, very strong higher low. This only reveals something we already know, NEAR is bullish and bullish means up. Prepare for growth. The 2025 targets can be seen on the chart.
» How likely is a new all-time high in 2025?
Probabilities are really, really high. NEAR Protocol has a very strong chart that points to a long-term higher high next. The ath being $20, it can easily go higher thanks to the strong higher low mentioned above.
» How long will it take for this new ath to be hit?
Can be anywhere between 4-8 months. I know it is a wide range but with thousands of altcoins, some will move first while others will take longer to reach their bull market top. But late 2025 is the main date and some altcoins will continue bullish through early 2026.
Yes, this pair can be approached with leverage.
Low leverage is better. Low risk is better. Spot is best.
Thanks a lot for your continued support.
Namaste.

NEARUSDT 1D AnalysisNEAR ~ 1D Analysis
#NEAR Buy again from here if you still have confidence in this coin with a short term target of at least 10%+ and a long term target of $8

NEAR to $45? The Signs Are All There…Just imagine traveling through time.
Many people look back with regret, wishing they had invested in cryptocurrencies before previous bullish cycles. We've all heard phrases like "If only I had bought Bitcoin at $100, I'd be a millionaire by now."
But the real question is: Will you have the courage to make the right decision when the moment comes?
You might think I'm crazy for presenting these targets today — and that's okay. But trust me, in a few months, you'll witness the phenomenal power of our analysis system. The market is fractal by nature; what happens on lower timeframes inevitably plays out on higher ones.
NEAR is one of the most promising blockchains, and all signals are aligning for a move toward $45.
The question is: Do you have the courage to take action now?

NEARUSDT UPDATE
Pattern: Descending Triangle Breakout
Current Price: \$2.937
Target Price: \$3.60
Target % Gain: 22.69%
Technical Analysis: NEAR has broken out of a descending triangle on the 8H chart. Price is closing above resistance with decent momentum, indicating a potential move toward \$3.60.
Time Frame: 8H

Near short continuation to HTF POINear is falling bellow the 200EMA on the 1H Time Frame and price is showing weakness trying to gain momentum to the upside.
Before we start the next big move up we need the price to go lower and grab some liquidity to have the necessary fuel to start the real move to the upside.

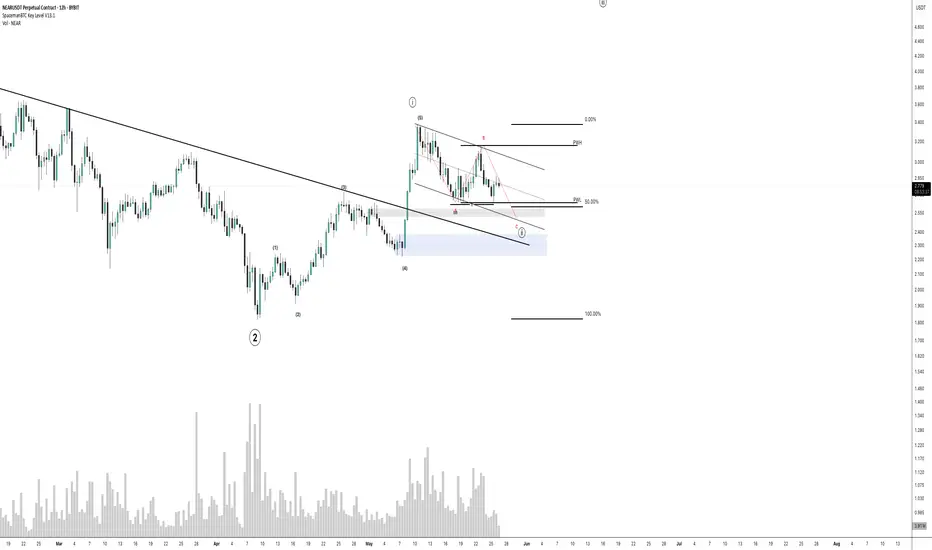
NEAR very bullish price actionNEAR is on its way to finish a wave 2 with a ABC pullback to Discount sweeping Previous Week Low.
If we close back bullish inside previous week range, we have a buy signal.
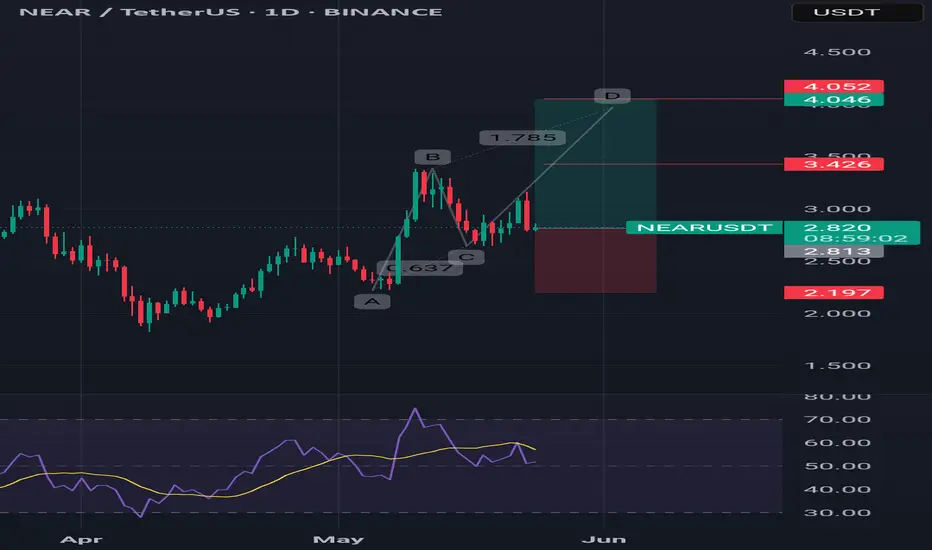
NEAR’s Pullback Zone Found — Is $4 Next?NEAR just pulled off a +50% rally from the 0.618 Fibonacci retracement at $2.224 — a strong show of force from the bulls. After that explosive move, price is now cooling off in a consolidation phase, preparing for the next leg higher.
🟢 Long Setup — Dip Before Lift?
The next high-probability long zone lies between:
$3.026 – $2.94
Possible but less likely of a deeper dip to $2.78 (0.5 Fib of the recent move)
Long entries can be laddered between $3.00 and $2.90 (even $2.80 if volatility kicks in).
Stop-Loss: Below the daily 21 EMA ($2.7344) and 21 SMA ($2.6739)
Target: $4.00
R:R: ~4:1 — clean and structured
This setup aligns with standard continuation behaviour after strong impulses — consolidation, retrace, and resume.
🔴 Short Setup (on Rejection at $4.00)
Entry: ~$4.00
Stop-Loss: Above $4.25
Target: Yearly open (~$3.65)
R:R: ~1.5:1 — not ideal, but valid on confirmation
🎯 Summary
NEAR is consolidating after a strong move — either ready to continue higher or retest deeper into Fib support
Long zone: $3.00–$2.90 (poss. $2.80)
Short zone: $4.00 (on rejection only)
Simple structure, clean risk, and nothing forced — exactly how it should be.
Sometimes, less is more. Let price show the next move. Stay ready. 📈
___________________________________
If you found this helpful, leave a like and comment below! Got requests for the next technical analysis? Let me know.

NEAR NEAR NEAR Hello friends
Considering the good growth we had, you can see that the price has corrected after reaching its ceiling.
Now, with the price correction, there is a good opportunity to buy in stages and with capital management and move towards the specified goals.
*Trade safely with us*

NEAR is here to stay!Hello TradingView Family / Fellow Traders. This is Richard, also known as theSignalyst.
After breaking above the falling wedge pattern, CBOE:NEAR has been overall bullish, trading within a rising broadening wedge 🔼 marked in blue and red.
📉 As it approaches the lower bound of the wedge — which perfectly intersects with the green support zone — we’ll be watching for short-term long opportunities 🎯.
From a long-term perspective, for the bulls to fully take control, a break above the $3.6 resistance is needed to confirm the next bullish wave 🚀.
📚 Always follow your trading plan regarding entry, risk management, and trade management.
Good luck!
All Strategies Are Good; If Managed Properly!
~Rich

NEAR Protocol price analysisIt's really hard for CRYPTOCAP:NEAR to grow now....
If we look at the wave analysis, we can assume that the OKX:NEARUSDT price could drop to $2.30-2.50 once again.
And from there, with renewed vigor, it will start upwards to break out of the protracted falling channel above $4.50
_____________________
Did you like our analysis? Leave a comment, like, and follow to get more

NEARUSDT Retest in Play After Breakout — Bulls May Take Charge!BINANCE:NEARUSDT has turned the tide after a prolonged downtrend, now forming higher highs and signaling a shift in momentum. Recently, it broke through a key resistance level, flipping it into support, a classic breakout-retest setup. Right now, price action is retesting that breakout zone, and if it holds, we could see a strong bounce and continuation of the bullish structure. This level is crucial, and a successful retest could pave the way for another leg up.
As always, don’t forget to manage your risk. keep a well placed stop loss in case the market flips unexpectedly.
BINANCE:NEARUSDT Currently trading at $2.8
Buy level : Above $2.75
Stop loss : Below $2.2
Target : $5.5
Max leverage 3x
Always keep stop loss
Follow Our Tradingview Account for More Technical Analysis Updates, | Like, Share and Comment Your thoughts

$NEAR 2H Trade Setup.Breakout from descending trendline, bounce from demand zone
. Entry: CMP
. SL: $2.62
. TP: $2.96 / $3.17 / $3.36
Clean breakout. Watching for follow-through.
DYRO, NFA

NEARUSDT - LONG-Price broke out of 3 month downward channel followed by solid demand which see price testing the 21 EMA.
-Retracing to 0.5 - 0.618 Fib level which happen to be Support level with good volume stack.
-Expecting price to go past 21EMA and retest 50EMA.

NEAR/USDT Swing Long Setup – Technical BreakdownTimeframe: 4H
Bias: Bullish Swing
NEAR is currently presenting a compelling swing long opportunity, as it trades around a high-confluence demand zone aligned with:
🔸 Previous structure resistance turned support (horizontal flip zone)
🔸 200 EMA dynamic support acting as trend validator
🔸 Volume Profile POC cluster indicating high interest zone for market participants
After a strong impulse move to the upside, the pair corrected back into this key demand zone and is showing signs of a potential reversal. The current price action shows bullish rejection wicks and buying pressure emerging right at the $2.65–$2.68 support band.
Entry Zone: $2.550–$2.65
Stop Loss: Below $2.450 (structure + 200 EMA break)
Target 1: $2.95
Target 2: $3.20
RR Ratio: ~1:2 to 1:3
A strong close below $2.50 would invalidate this setup and shift the short-term bias to neutral/bearish. Use confirmation and manage size accordingly.
Let me know your thoughts – agree or disagree?
📌 Like & follow for more setups
#NEAR #Crypto #SwingTrade #TechnicalAnalysis #Altcoins #USDT #TradingView #CryptoAnalysis #MarketStructure #EMASupport

Keep an eye on it.As I said in the previous analysis, it has started its growth.
It has exited its downward channel and has made a pullback. You can enter a buy trade after the daily candle closes today. (If the bullish candle closes)
.
.
I hope you have used our team's analysis.
If you want to stay up to date with the market growth, follow our page.

NEAR/USD.tBeautiful setup on the daily to go long! Broke daily resistance a few days ago and price is coming back to make a higher low...mitigating the demand zone. I cannot stress the importance of trading price structure and being patience enough to my fellow trading friends. Once the higher low is established... a invalidation zone will be created where you can start closing positions once price breaks support in the next few weeks or maybe months!

Will NEAR soon be worth $6?NEAR had a clear breakout on the daily timeframe. I see it heading towards $6 in the short term, where major liquidity lies.

NEAR Protocol Buy ZoneNEAR is currently in a buy zone between $2.80 and $2.66. If BTC holds the $102K support, the low may already be in before the next leg up.
This setup offers a strong risk-to-reward (R:R) ratio of 10, targeting $9, with a stop-loss below the previous low at $2.20.

#NEAR/USDT#NEAR
The price is moving within a descending channel on the 1-hour frame, adhering well to it, and is heading for a strong breakout and retest.
We are experiencing a rebound from the lower boundary of the descending channel, which is support at 2.90.
We are experiencing a downtrend on the RSI indicator, which is about to break and retest, supporting the upward trend.
We are looking for stability above the 100 Moving Average.
Entry price: 2.94
First target: 3.03
Second target: 3.14
Third target: 3.30

NEAR – Base Breakout Setup at $3.37: Is Altcoin Season Here?NEAR Protocol ( CRYPTOCAP:NEAR ) is setting up for a potential breakout, and it’s not just a technical play — the market narrative is shifting:
🔹 Base Breakout at $3.37
Price is pressing against the $3.37 resistance, a clear base breakout level.
Volume is increasing, signaling accumulation.
Strong support just below at $3.20 keeps risk tight.
🔹 Altcoin Season Potential
Bitcoin dominance is starting to decline — a classic early sign of an altcoin run.
Ethereum ( CRYPTOCAP:ETH ) has already gone on a massive run — could NEAR and other altcoins be next?
In previous cycles, declining BTC dominance often triggers massive runs in altcoins.
🔹 My Trading Plan:
1️⃣ Initial Entry: Starter position at $3.37 breakout, adding on strength.
2️⃣ Anticipatory Entry: Dips into $3.20 support with a tight stop below.
3️⃣ Stop Loss: Below $3.20 for any initial position — keeping risk defined.
🔹 Why This Setup is Compelling:
Clear base breakout with altcoin narrative tailwinds.
Bitcoin dominance declining is a key macro signal.
Ethereum’s strength adds confidence to the altcoin trade.

NEAR Harmonic Reversal Setup with Clear Demand ConfirmationNEAR is shaping up beautifully within a bullish harmonic formation, completing around the 1.239 Fibonacci zone, precisely where price tapped into a major structural low and bounced back into the immediate buyback zone. This bullish reaction aligns with a clean demand retest and marks the beginning of a potential macro reversal.
Price action is now gearing towards the mid-range resistance near 4.91, and a break above this level will serve as a high-conviction trigger toward the major target at 9.05. Final projected leg leads into the high extension region of 23.99, forming a long range bullish continuation model.
As long as the demand zone holds firm, this remains one of the most structurally sound altcoins to monitor for exponential upside. Full validation will be confirmed once we reclaim above 4.91 with volume.
