NEAR 4 Hour Long Trade Idea Using my crazy Fibonacci levels, for a long trade on Near should BTC retrace. Using the falling wedge pattern as a guide.
NEARUSDT trade ideas

NEAR ($NEAR): Technical rebound in mid-termTrend is still bearish on daily and weekly chart, but at the same time we do not exclude an interesting technical rebound in mid-term. In this analysis we just wanted to share our view and how it could develop (Impulsive Structure), for more details on support and resistance levels, visit our Blog. With this in mind, from a technical point of view, AMEX:NEAR still remains under pressure, so we do not rule out a bearish consolidation before a price recovery.
🔴 TRADING STRATEGY
The best strategy may be to accumulate long positions on weakness (by the dip) with small sizes.
🔴 RISK MANAGEMENT
Use only the portion of assets willing to lose (1%/2%)
Analysis by
Anonymous Banker Team
Like | Share | Comment


NEAR looking very bullish IMONear is about to escape the symmetrical triangle, leading to a good pump upwards.

The Reversal is NEAR 🏹Hello TradingView Family / Fellow Traders. This is Richard, also known as theSignalyst.
📈 NEAR has exhibited an overall bullish trend , trading above the red trendlines zone.
At present, NEAR is undergoing a correction phase and it is currently approaching the red trendline acting as a non-horizontal support.
Moreover, it is retesting a strong demand zone marked in green.
🏹 Thus, the highlighted blue circle is a strong area to look for buy setups as it is the intersection of the green demand and lower red trendline acting as a non-horizontal support.
📚 As per my trading style:
As #NEAR approaches the lower blue circle zone, I will be looking for bullish reversal setups (like a double bottom pattern, trendline break , and so on...)
📚 Always follow your trading plan regarding entry, risk management, and trade management.
Good luck!
All Strategies Are Good; If Managed Properly!
~Rich

NEAR long updateAMEX:NEAR went through SL in my sleep. Decided to re-enter this morning on trendline...
#trading
@NEARProtocol

NEAR Protocol - LONG NEAR Protocol - LONG
Plan for Near protocol which has been trending for the last few weeks & has a resurging ecosystem. It is bringing as AI initiative and is one of only 4 coins with a 'Data Availability' category on Coinmarketcap alongside - NOIA, TIA & SYS. imo its an ecosystem to keep a close eye on esp with the Co-founder being an integral part of ChatGPT 'Transformer' technology.


NEAR/USDT TRADE SETUP! #NEAR:
Entry Point:
Buy at CMP: Consider entering the trade at the Current Market Price (CMP), taking advantage of the current market conditions.
Additional Entry: Be prepared to add more positions if the price drops to $3.34. This level is identified as a potential strategic buying opportunity.
Target Prices:
Set specific target prices at $3.52, $3.6, $3.78, $4.01, and $4.2. These levels represent potential profit-taking points as the price moves upward.
Stop Loss (SL):
Set a stop-loss at $3.236. This level is chosen to limit potential losses and effectively manage risk.
Leverage:
The recommendation advises maintaining low leverage and entering the market at the lowest possible price. It suggests a gradual entry approach and encourages traders to avoid sudden decisions. Using leverage cautiously is crucial to minimize risk.
Cautionary Note:
Reminds traders to do their own research (DYOR) before making any trading decisions. This reinforces the importance of conducting personal research for informed decision-making.
Includes "NFA" (No Financial Advice), emphasizing that the provided information is not a recommendation for financial decisions.
In summary, the recommendation outlines a trading strategy for #NEAR, providing specific entry points, target prices, and a stop-loss level for risk management. It emphasizes caution with leverage, gradual entry, and the necessity of conducting personal research. As always, the information is not financial advice.

Near 🔥at the daily view, we have a flag pattern and at the this view red line is good zone to start go up for 5.5$ ~ 6$ targets

NEAR Foundation Cuts Workforce by 40%
The AMEX:NEAR Foundation, the driving force behind the Layer 1 blockchain NEAR Protocol, has recently announced a significant restructuring plan that involves a 40% reduction in its team. This decision, revealed by CEO Illia Polosukhin on January 11, comes as the organization shifts its focus toward a more targeted set of activities. The move is said to be a result of an internal review that identified inefficiencies within the Foundation's operations, prompting a strategic consolidation of its core team.
Downsizing Details:
The restructuring plan will impact 35 team members across various departments, including marketing, business development, and community teams. In his announcement, Polosukhin expressed the Foundation's commitment to supporting the affected colleagues during this transition, facilitating their exploration of new opportunities within the NEAR ecosystem, the broader Web3 industry, and beyond.
Review Findings:
The decision to downsize appears to be rooted in a comprehensive review of the Foundation's activities, revealing shortcomings in its effectiveness. Polosukhin stated, "Following this review, we have decided to significantly consolidate the core Foundation team to focus on a narrower and higher-impact set of activities." This strategic realignment aims to enhance the Foundation's overall efficiency and impact in the blockchain space.
Financial Standing:
Despite the organizational changes, Polosukhin reassured the community that the NEAR Treasury remains robust. With over $285 million in fiat currency, 305 million AMEX:NEAR tokens (valued at over $1 billion), and $70 million in investments and loans, the Foundation maintains a strong financial position. This stability provides a foundation for the ongoing development and growth of the AMEX:NEAR Protocol.
Allegations by Wintermute:
In November, crypto market-making firm Wintermute raised serious allegations against the AMEX:NEAR Foundation and its subsidiary Aurora Labs. Wintermute's founder and CEO, Evgeny Gaevoy, accused the Foundation of failing to honor an $11 million redemption deal related to NEAR's now-defunct stablecoin, USN. The transaction was supposed to allow Wintermute to redeem USN for USDT on a 1:1 basis. However, NEAR Foundation allegedly refused to honor their commitments, leaving Wintermute without the expected USDT despite submitting the redemption request months earlier.
Conclusion:
The AMEX:NEAR Protocol's recent restructuring and the subsequent allegations by Wintermute add a layer of complexity to the blockchain project's narrative. As the AMEX:NEAR Foundation navigates these challenges, the broader blockchain community will be watching closely to assess the impact on the protocol's development, adoption, and overall reputation. The combination of internal changes and external criticisms underscores the dynamic nature of the blockchain industry and the importance of transparency and accountability in sustaining trust within the ecosystem.

NEAR BUY SETUPIt has a structure that can pull back upwards.
The green area of the swap is a good place to take a buy/long position.
Fixing a 4-hour candle below the flip range will violate the analysis.
For risk management, please don't forget stop loss and capital management
Comment if you have any questions
Thank You

NEARUSDT LongLong Position
Signal Validity: 2D
Order Price: 2.95
TP: 3.65
SL: 2.587
CROSS 3X
Margin: 2% Capital
Risk/Reward ratio: 1.97

NEARUSDTNEARUSDT was trading in descending parallel channel. The price was reacting well the support and resistance of descending channel.
Currently the price has given the breakout of channel and now retesting the broken level where it is also forming a local support zone and seems like the price may go for another leg higher.
If the breakout sustain to upside the optimum target could be 4.3.
What you guys think of this idea?

NEAR 2x Pump is Next!?Not sure what you think but it feels like a mega pump for Near Protocol coming next!

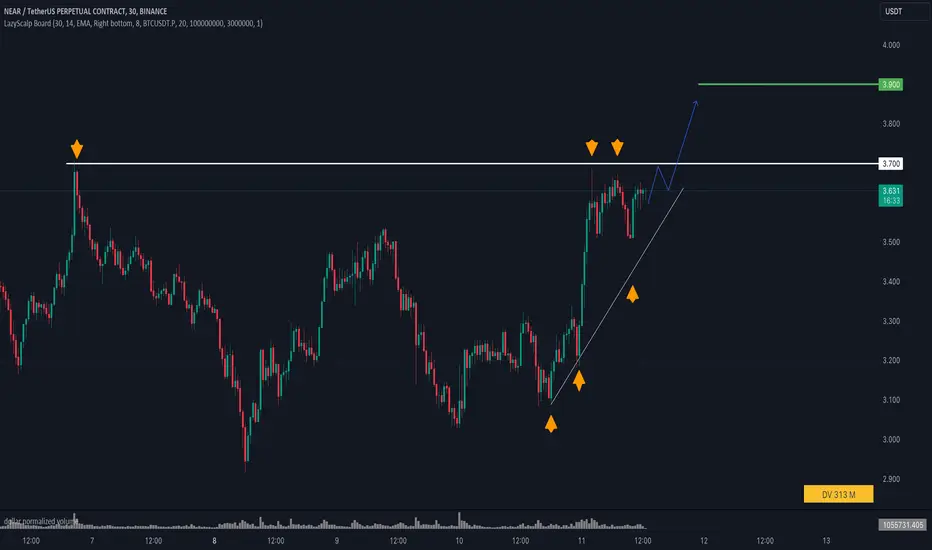
⬆️ I'm expecting an impulse breakout to $3.9! #NEARUSDT LONG #NEARUSDT from $3.7
30m TF. The NEAR coin is actively growing and has currently formed a compression near the horizontal resistance level. The daily trading volume has been increased to 300 million. The local trend is upward (noticeably by the loyalties rising over the last day), which indicates the dominance of buyers. The basis for entering the transaction will be trading below the level, purchasing activity and, as a result, an impulse breakdown with the withdrawal of liquidity.
More deals in our channel, link in the profile header.


NEAR/USDT preparing for upward momentum? 👀🚀NEAR Analysis💎Paradisers, take note of the current trend in #NEARUSDT, which is indicating a likely bullish continuation from its current demand zone.
💎 NEAR Protocol recently experienced a decline after facing rejection at a strong supply level. Currently, it's gathering momentum in the demand zone at $2.877. If it can maintain momentum above this level, there's a considerable probability of an upward movement, targeting the higher supply level at $4.483.
💎 However, if #NEAR encounters difficulties in sustaining above the $2.877 demand level, a strategic reassessment may be necessary.
💎 In such a scenario, we would shift our attention to a possible bullish ascent from a lower support level at $2.289. Keeping a close watch on this level is crucial, as a drop below it could necessitate a strategic shift, underlining potential obstacles in maintaining a bullish trajectory in the #NEAR market.

NEAR Bullish ScenarioExtreme fear in altcoins and what bloodbath some whales created but they can't kill good altcoins for BTC ETF.

NEAR Near is currently heading towards the support area.
The weekly support will be the best spot for bull market, make sure to buy some in that area.

Near reveresed on the 2H. Next stop $4.6, $5.25, then $6.11Bear channel is finished. Time to move up!
2H confirmed direction change, Next stop $4.6, $5.25, then $6.11.
