NEAR LONG AMEX:NEAR Ignore the Noise & Hold with Patience..!!
NEARLY FORMED POSITIVE CANDLE FOR 1H, THERE IS A 2% CHANCE, MY OPINION IS THAT IT WILL REACH THE RESISTANCE FOR THE DAY
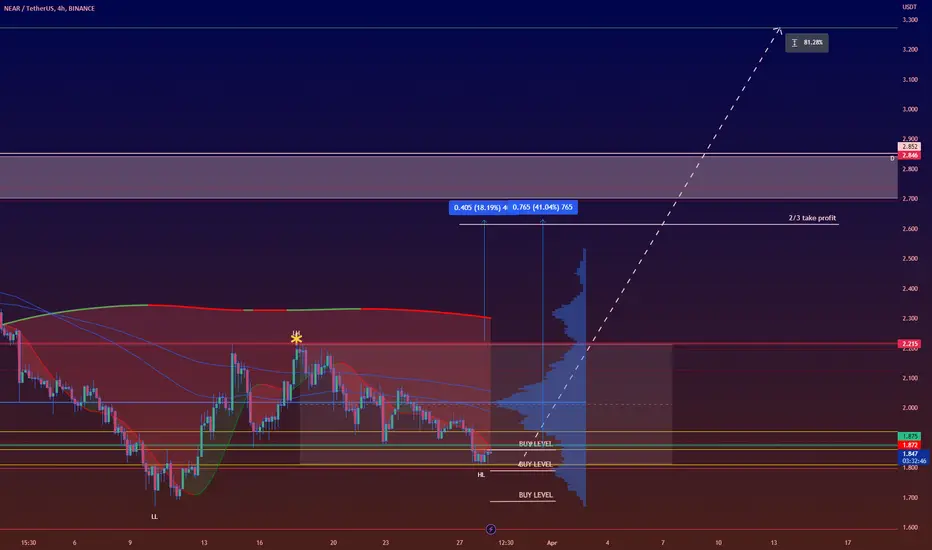
NEARUSDT trade ideas

NEARUSDT 4H LONGW in RSI, breaking the middle line and moving RSA, breaking the trend line, suspicious candle, confirming candle, breaking moving 50 in 4 hours BINANCE:NEARUSDT KUCOIN:NEARUSDT


All in on NEARNEAR been on radar for several days now and think its time it gives10-15%. Trade safe.


NEARUSD1DMA200 REJECTION 1DMA50 SUPPORTNEAR seems to be experiencing a rejection at the 1D MA 200 resistance but it has a 1D MA 50 that has just been breached to fall back on as support. If that fails a cluster of demand zone and diagonal support is not too far from that point increasing the probability of an uptrend for near. We can look for buy setup at any of this areas but the safest buy opportunity is one after the 1D MA 200 has been conclusively breached

W9.1-35 NEAR BULLISH IDEA (DOUBLE BOTTOM)Potential Bullish Entry Dow Theory In Place - Higher High and Higher Low Expected in Place Formation of DOUBLE bottom coupled with bullish divergence (Bullish reversal pattern) SL & TP Levels are defined.

NEARUSDT wants breakout?Hello traders, NEARUSDT is currently on a support and I expect a breakout..
everything is clear on the chart..
R:R = 1 : 6.87
enjoy trading <3

NEARUSDT Elliott Waves AnalysisHello friends.
Please support my work by clicking the LIKE button👍(If you liked). Also i will appreciate for ur activity. Thank you!
Everything on the chart. (update)
We got some complication but everything is relevant.HOLD
Entry: market and lower
Targets: 3 - 3.5 - 4 and maybe even ~5(not sure)
after first target reached move ur stop to breakeven
Stop: ~1.3 (depending of ur risk). ALWAYS follow ur RM .
RR: 1 to 5
risk is justified
Good luck everyone!
Follow me on TRADINGView, if you don't want to miss my next analysis or signals.
It's not financial advice.
Dont Forget, always make your own research before to trade my ideas!
Open to any questions and suggestions

NEAR approaching short targetNEAR failed to hold the prior resistance/support level after the breakthrough causing a 'fake out' and now heading for our target short price range. Let me know what you think

NEARUSDT, time for a bull run?NEARUSDT / 1D
Hello traders, welcome back to another market breakdown.
NEARUSDT has been showing some kind of accumulation pattern which might lead to a short squeeze.
For more confirmation wait for the trend line to be broken.
Trade safely,
Trader Leo.

NEAR - I will invest at $0.5Hello, guys!
It's time to consider the altcoins which I plan to invest in. The first one is NEAR. I know it's fundamentally strong crypto asset which will show the huge growth in the next bull cycle with the high probability.
I marked the large bear market waves 3 and 4 and potential wave 5 to make it clear which market straucture I am going to trade. I consider now NEAR is printing last wave 5 which shoul contain with 5 waves also. It looks like nowa asset is in the wave 3 - the most impulsive one. Thus, in my opinion any purchases now are too dangerous. The target area where I expect the bottom is 1.61 Fibonacci extension. This is approximately $0.5 per coin.
Best regards, Ivan
_______________________________________
Subscribe now and never miss an update 👍

Back to mid term supportAfter 4 times, break out attempt on 2.40, price is heavily rejected.
It has moved to a midterm trend line. But RSI is heavily sold, currently 29. It might have maybe 1 more day to go , But i predict, these are the levels it will hold.

NEAR/USDT inside uptrend channelWe have entered a channel as seen between blue lines. I expect the price will breath till 2.31 , as current levels and after touching lower band, i expect price action between 2.55 - 2.65. If delay occurs in the action , upper band only rises. also there is a huge resistance waiting for the trend between 2.7 and 2.9.
This band played role in june 2021 - June 2022 (as support) and Feb 2023 (as resistance).
Let's see.

✅TS ❕ NEARUSD: reached the resistance✅✅ NEAR/USDT broke the upward structure.
The chart instantly reacted to the resistance area.
The price of the asset will turn around and begin to decline. ✅
🚀 SELL scenario: short to 2.13 🚀
----------------------------------------------------------------------------
Remember, there is no place for luck in trading - only strategy!
Thanks for the likes and comments.

NEAR shortNEAR broke trough the ascending trendline. Asset broke trough the support level. Bearish movement to support level at 1.98 is possible.

NEAR | Just broke 200MA after one year!#NEAR/USDT
- NEAR broke 200MA after for the first time since May 2022 and that is a very positive signal.
- Also we have a higher low and a higher high for the first time since some weeks.
- we are forming Wave C of ABC Elliot correction wave.
- Wave C is typically at least as large as wave A and often extends to 1.618 times wave A or beyond.
🟢Entry price: from now at 2.313 to 2.116
🎯Targets:
|> 2.66
|> 3.224
|> 3.75
🔴Stop-loss: Daily candle closes under 1.95
➡️Recommended risk: 0.25%
➡️Recommended total Positions Size: 3.1%


NEARUSDT BULLISH SHORT TERMNEARUSDT is possibly forming a Harmonic pattern here and has given us a good entry with targets in sight.

NEAR looks bullish (1D)Hi, dear traders. how are you ? Today we have a viewpoint to BUY/LONG the ICP symbol.
For risk management, please don't forget stop loss and capital management
It is one of the symbols with great potential that can make good climbs
When we reach the first target, save some profit and then change the stop to entry
Comment if you have any questions
Thank You

Triangle Breakouts, Pump? Wait !!!This was the most trending coin in 2021. This coin will not come in trend again for next 2 years. But before we forget this coin, It will take final small pump. Waiting for Triangle breakout, Currently it's no trade zone. Below the Red line is risk. Above the green trend line is good to buy. Wait.... And follow me for timely updates.

NEAR short following BTCI expect an exit from the triangle and the price decrease, follow the bitcoin (down)

NEARUSDT : 80% Mid-term 40% Short-termDisclaimer
High Risk Investment
Trading cryptocurrencies and Forex carries a high level of risk, and may not be suitable for all investors. Before deciding to trade cryptocurrency you should carefully consider your investment objectives, level of experience, and risk appetite. The possibility exists that you could sustain a loss of some or all of your initial investment and therefore you should not invest money that you cannot afford to lose. You should be aware of all the risks associated with cryptocurrency and Forex trading, and seek advice from an independent financial advisor. Since Any opinions, news, research, analyses, prices, or other information contained on this website is provided as general market commentary, and does not constitute investment advice. The Bibres will not accept liability for any loss or damage, including without limitation to, any loss of profit, which may arise directly or indirectly from use of or reliance on such information. All opinions expressed are owned by the respective writer and should never be considered as advice in any form.
A qualified professional should be consulted before making any financial decisions.
-----------------------------------