NEARUSDT wants the breakout?NEARUSDT has formed a rounded bottom chart pattern, which is a bullish technical signal indicating a potential reversal in the price trend. This pattern is characterized by a gradual decline in the price followed by a rounded bottom formation, and then a gradual increase in the price.
Currently, on the 4-hour timeframe, the price of NEARUSDT is testing a resistance level, which is an important price point that the market has had trouble breaking through in the past. If the price manages to break above this resistance level, it could indicate a significant bullish momentum and signal a potential long position.
According to Plancton's Rules, a breakout above a resistance level is a strong indication of a potential long position. Therefore, if the price of NEARUSDT breaks above this resistance level, traders may consider opening a long position.
–––––
Follow the Shrimp 🦐
Keep in mind.
🟣 Purple structure -> Monthly structure.
🔴 Red structure -> Weekly structure.
🔵 Blue structure -> Daily structure.
🟡 Yellow structure -> 4h structure.
⚫️ Black structure -> <= 1h structure.
Follow the Shrimp 🦐
NEARUSDT trade ideas

nearusdt H4Hi Guys , hope you well
Chart show you everything's
SecondChanceCrypto
⏰16/April/23
⛔️(DYOR)


NEAR/USD - Cup & Handle - Bullish Continuation PatternNEAR/USD has formed a Cup & Handle pattern. This is a bullish continuation pattern and price is likely to reach projected price (arrow on chart).

📈Can NEARUSDT reach 4$? / altseason is coming📉BINANCE:NEARUSDT
COINBASE:NEARUSD
Hey everyone, first take a look at my previous analysis and positions.
As previously analyzed, alt-season is coming.
In order to continue the upward trend, Bitcoin should keep the 28K level & Ethereum needs to stay
above 1900.
Don't forget to risk-free your position.
Please share ideas and leave a comment,
let me know what's your idea.
CrazyS✌

✴️ NEAR Protocol Same As Cardano...Read the Cardano analysis I just published... It is the same and this is what will happen with NEARUSDT.
We had a correction that ended 10-March, the exact same date and after this correction what follows is another bullish wave.
Very easy... And thus we should expect a higher high next .
That's NEAR Protocol for you.
Namaste.

2.0 resistance has become supportI expect 2$ support (recently resistance) will help to lift the price till
2.18 first and then 2.25.
Bitcoin Dominance continues to decline. Another support point.

Possible Short Plan for NEAROKX:NEARUSDT
The completenes of a Bearish BAT Setup is over the line but we can see side slip with a bearish engulfing.
If it is complete as we predicted we will be ready to short it.
Alarm set.
Good Luck Everyone.


NEAR looks like it's about to take off!NEAR looks a lot like other coins with made their way to touch the 200 EMA on the 1D. If BTC remains put it might give this a pump so watch out. as always DGR (Don't get REKT)


Near top top 🌳🌪️The technical analysis currently reveals a promising bullish trend in the NEAR market. The price is approaching a long-term simple moving average (SMA) and demonstrates a strong bounce. This positive momentum could lead to the appearance of "golden crosses", where a short-term SMA crosses above a longer-term SMA (another strong line). These technical signals bolster optimism for the continuation of the ongoing upward trend in NEAR.
On some day, it will jump

Significance of the 2.240-2.328 intervalHello?
Traders, welcome.
If you "Follow", you can always get new information quickly.
Please also click "Boost".
Have a good day.
** Analysis of the BTC chart publishes new ideas once a week.
** However, we publish new ideas when volatility occurs or when we show signs of diverging from our expectations.
** Excluding the above situation, BTC analysis is listed as a daily update.
-------------------------------------
(NEARBTC 1W Chart)
The key is whether it can rise above 0.0000 9561 to 0.0001 0554.
-------------------------------------------
(NEARUSDT chart)
You can see that a volume profile section is formed around 2.240-2.328.
So, the question is whether it can sustain the price by moving above 2.328.
The area around 3.198 is an area where you can buy in long-term terms.
So, a rise to 3.198 is the target for now.
-------------------------------------------------- -------------------------------------------
** All descriptions are for reference only and do not guarantee profit or loss in investment.
** Even if you know other people's know-how, it takes a considerable period of time to make it your own.
** This is a chart created with my know-how.
---------------------------------

Nearusdt Breakout Soon Nearusdt
NEAR/USDT is currently forming a symmetrical triangle pattern, which suggests that the price is consolidating and preparing for a potential breakout. If the breakout is successful, we can expect to see a bullish move in the coming days or weeks. However, as with any market, there is always a risk involved, and proper risk management should be used when trading.
It's important to wait for confirmation before entering any position. A confirmation in this case would be a strong bullish candlestick closing above the upper trendline of the symmetrical triangle pattern. On the other hand, a failed breakout could lead to a downside move, and traders should be prepared for both scenarios.
Overall, the symmetrical triangle pattern in NEAR/USDT suggests that a breakout is imminent, and traders should keep a close eye on this market for potential trading opportunities. As always, it's recommended to conduct your own research and use proper risk management techniques before making any trades.
If You are satisfied with our work join us

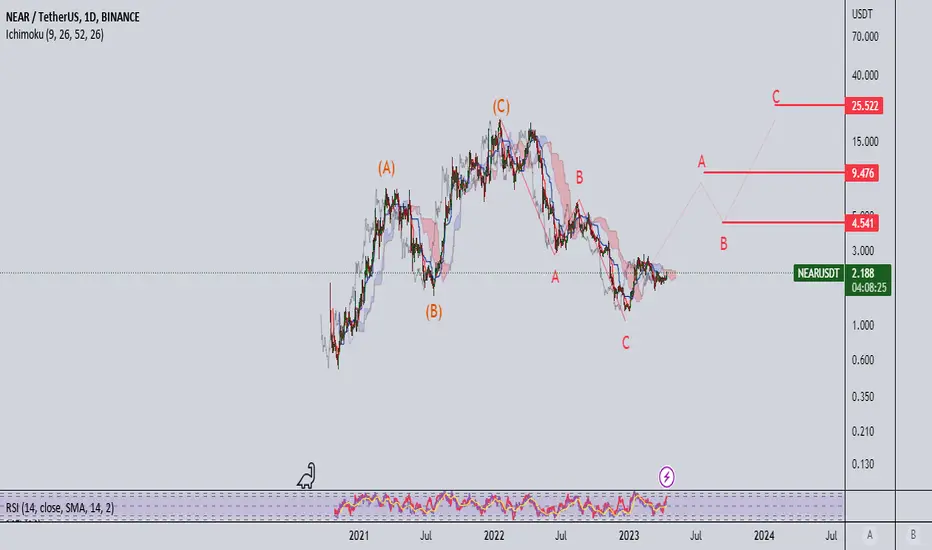
NEARUSDTclassic wave pattern could be accured as N PATTERN (or ABC) and its on the Third wave which is C and might be filled as I show on the chart and the targets are mentioned as well
NEAR Triangle-Pattern" S&R in short-term>?>I Have Tried My Best to Bring the best Possible outcome in this Chart.
NEAR can continues to rising price in case of break It"s T-Pattern.
Everything We need's cleared on the chart.
Must important level's marked on the chart.
It's just an analyze,
Not a financial advise.
PLZ DYOR
With hopping success>>>>>>>>>
