the most damaged project. in rise it goes like a tortoise, in drop goes like ice cream... very bad price action... too much manipulated...
NEAR / TetherUS forum
the most damaged project. in rise it goes like a tortoise, in drop goes like ice cream... very bad price action... too much manipulated...
Check the latest analysis: youtu.be/clwoI8VdGYk
infinitely accumulating...
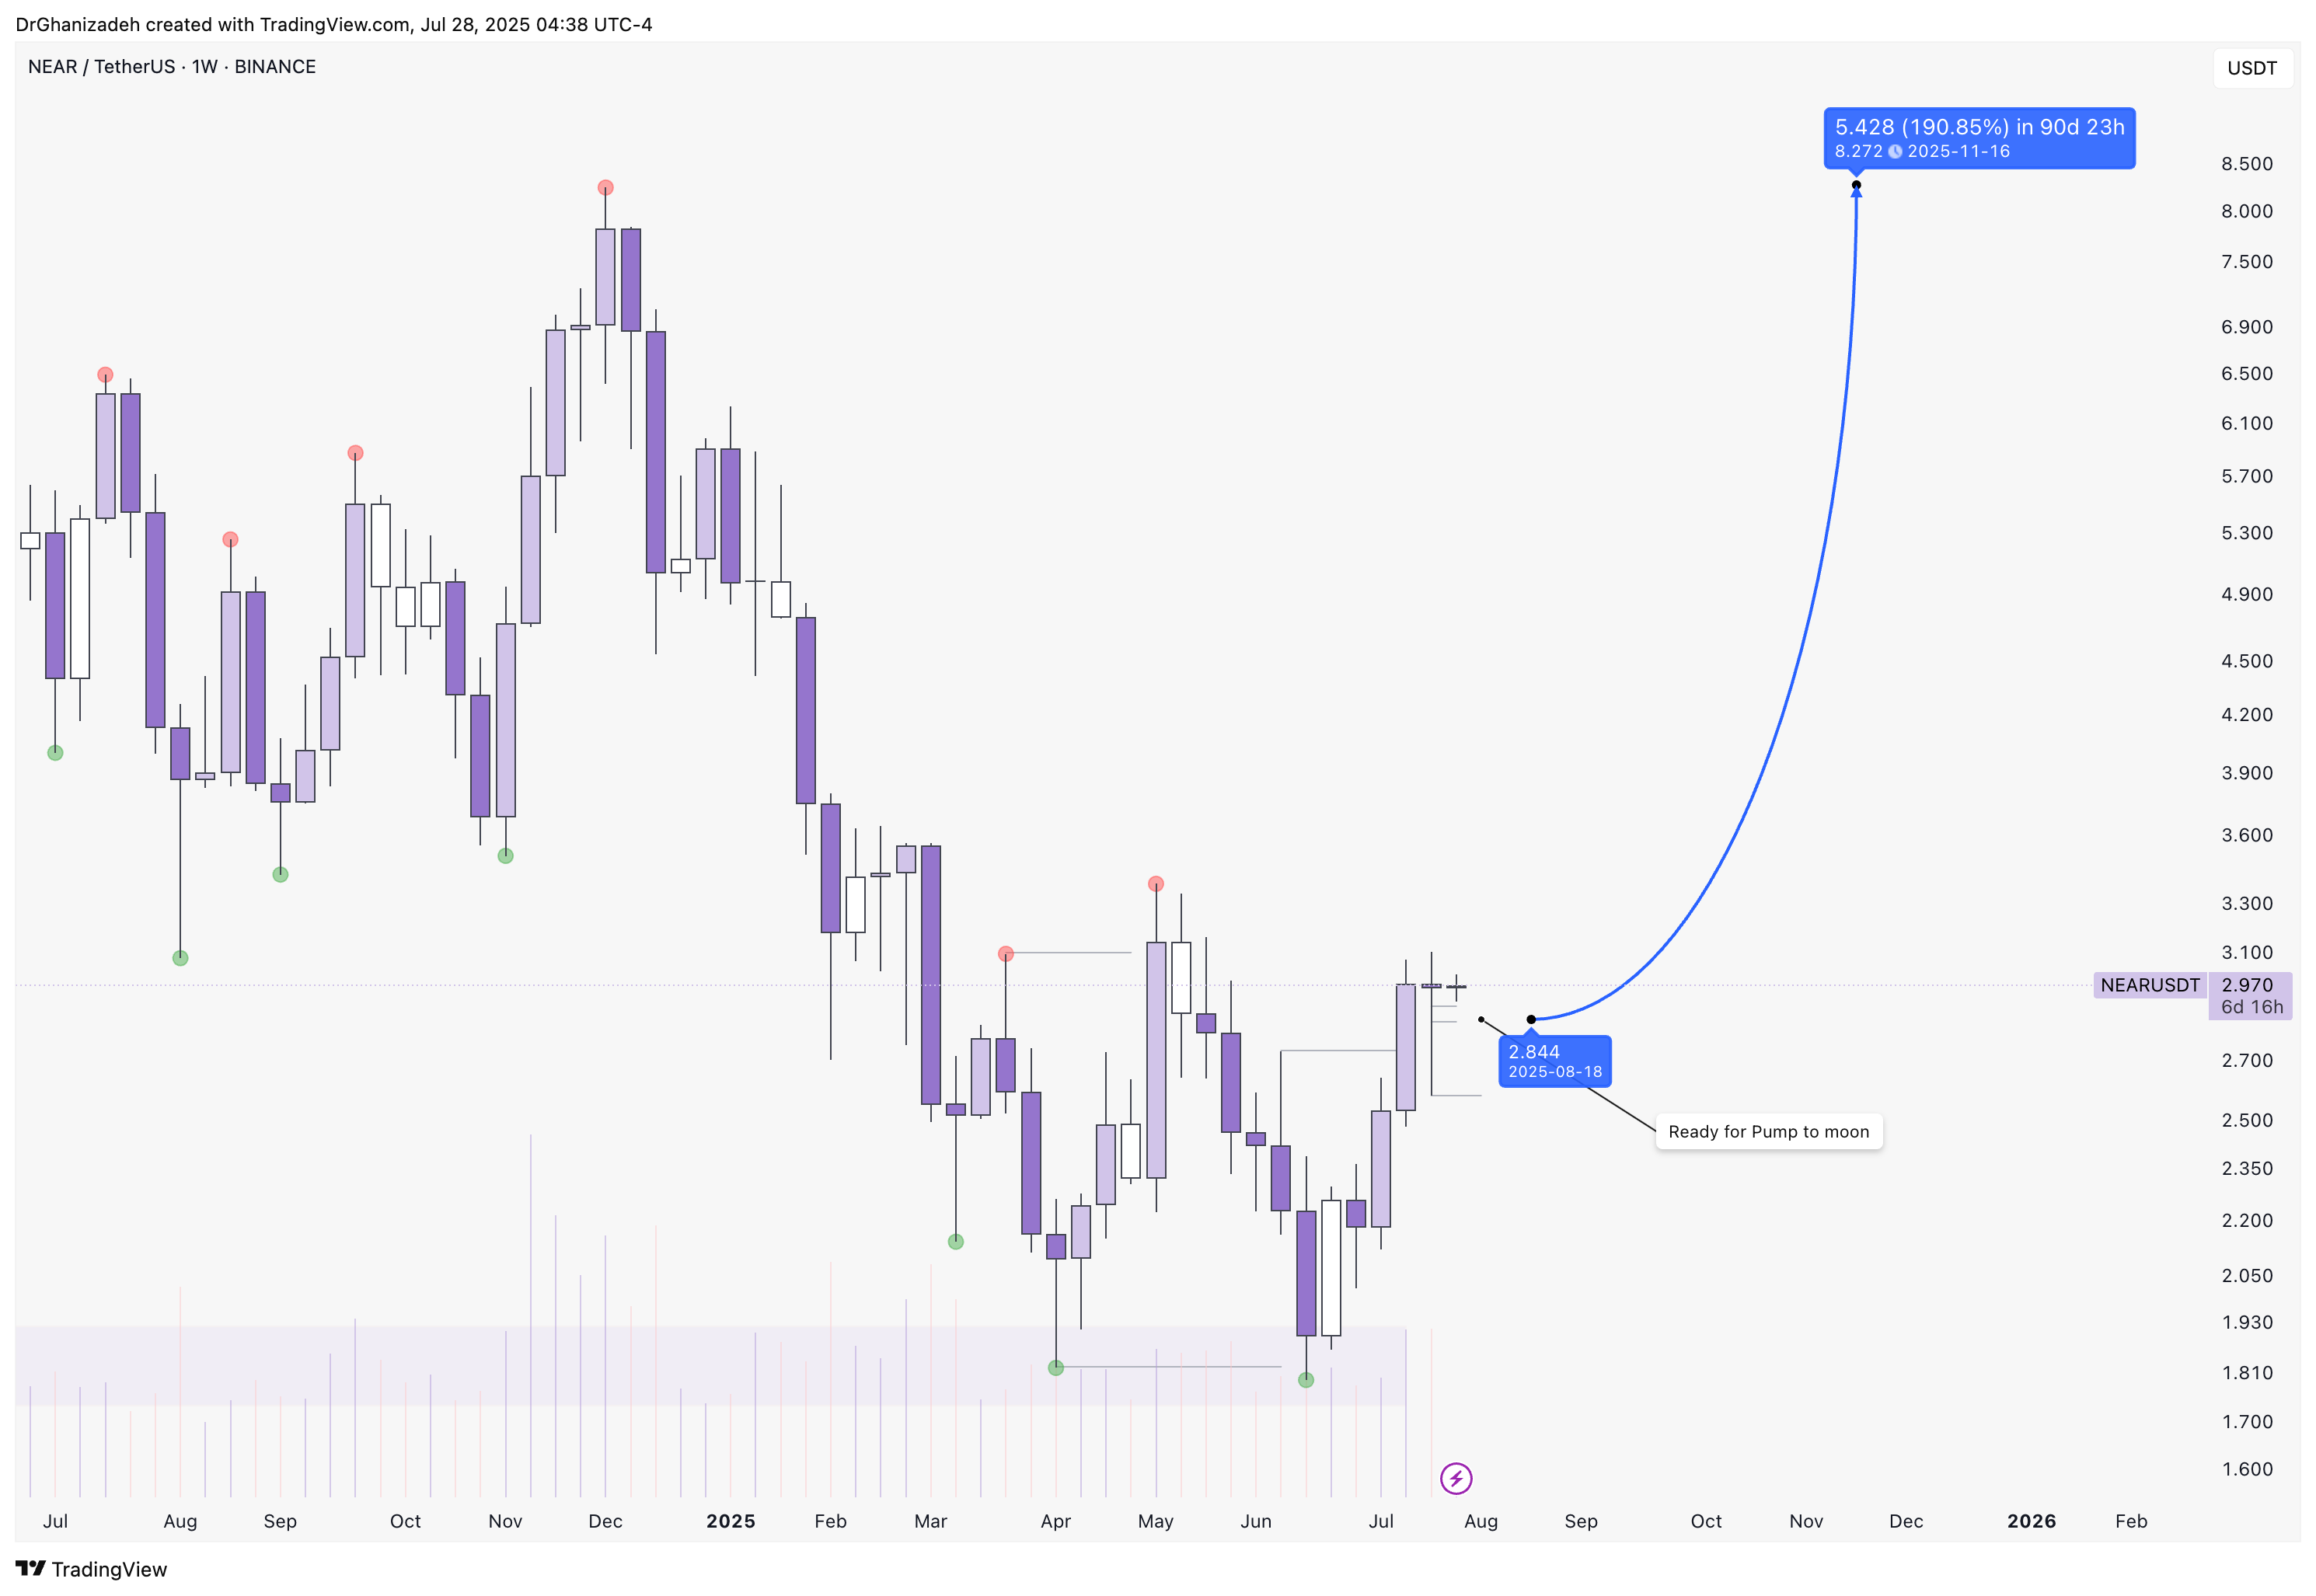
it is stuck on range 2-3.2$ since 1 february.
around six months accumulating and still no pump...
the only big market cap not performing around.
etherium from 1800 to 3200 , near from 1.8 to 2.6.
very bad.