AC trade ideas


WHICH PRICE A NOVICE INVESTOR MUST BUY AIR CANADA-04-17-2020******************************************************************************************************************************************************************************
Decisions to buy, sell, hold or trade in securities and other investments involve risk and are best made based on the advice of qualified financial professionals. Any trading in securities or other investments involves a risk of substantial losses. The practice of “Day Trading” involves particularly high risks and can cause you to lose substantial sums of money. Before undertaking any trading program, you should consult a qualified financial professional. Please consider carefully whether such trading is suitable for you in light of your financial condition and the ability to bear financial risks.
************************************************************************************************************************************************************************
WHAT CHART PATTERN AIR CANADA IS PROBABLY BUILDING?
The forex rising wedge (also known as the ascending wedge) pattern is a powerful consolidation price pattern formed when the price is bound between two rising trend lines. It is considered a bearish chart formation that can indicate both reversal and continuation patterns – depending on location and trend bias.
source:https://www.dailyfx.com/education/technical-analysis-chart-patterns/rising-wedge.html
WHEN SHOULD WE TAKE POSITION?
WE CAN TAKE POSITION AT ANY TIME IF YOU ARE A GOOD INVESTOR AND YOU CAN ANALYSE QUICKLY WHAT THE MARKET IS GOING, ACCORDING TO THE PREDILECTION WEDGE PATTERN HAS 5 POINTS SO WE CAN TAKE POSITION IN POINT B, C, D, E BUT THE RISK LEVEL IS NOT THE SAME
B IS STRONGLY HIGH
C IS HIGH
D IS MEDIUM
E IS LOW
THE RECOMMENDATION FOR INVESTORS AND NOVICE PEOPLE WILL BE TO WAIT FOR THE BEST TIME AND THE BEST TIME WITH A LOW RISK IS THE POINT " E BECAUSE THE MARKETS WILL REACH A GOOD SUPPORT LEVEL TO CHANGE BEARISH TREND TO A BULLISH ONE.
IN CONCLUSION, THE BEST PRICE IS AROUND $8-$6 .


AC 1D Chart AnalysisThis is an updated Air Canada 1D chart from A&T Holding Corporation.
So as per our previous analysis, the stock has broken through the downward moving triangle and now it's taking the W-shape as shown above. Our revised target is a $30-32.00 range for long positions.
Shorts should set a stop-limit below the above trading zones shown.
Please feel free to use the comment section below to let us know your thoughts, opinions, and/or questions.


AC.CA Air Canada Newbie here so take this with a big grain of salt.
Expecting AC.CA to test the $19 range and then pull back to $15 at some point next week.

Inverse Head and Shoulders Setting Up - Short/Put NowInverse head and shoulders pattern shaping up on AC. After a 40% bounce in 4 days from the bottom of the head, expect the top of the shoulder to hit today/tomorrow before pulling back and making the right shoulder.

AIR CANADA RSI APRIL 1ST WEEK ENDING PREDICTIONLooking to see if the RSI has any merit in telling us if AC.TO will fall based on current investor sentiment and the decision to put over 16k of workers on furlough or if it's just "follow the fancy lines" times and wait until it goes below the 20th percentile before we place a trade.

Air Canada 1D Chart Analysis UpdatePreviously we at A&T Corp. had posted the 4H chart on Air Canada and it looks like it's following the same pattern so far and so here's an update on what looks like is happening.
The downtrend is still on-going but this time the sell-off is gradual but steady and therefore, we can see the last bit of the Elliot wave is going at a lesser gradient than before. We think this wave will complete at this rate and maybe a little faster movement next week could be expected. The key point here is that the previous bottom might be breached to find and establish a new support level.
Note: Remember a break-out towards the top of the triangle (current resistance) may still trigger a buying frenzy.
Keep shorting the 1D chart till it reaches previous levels of $10.0 to $11.0. Stop-limit shorts to clear break-out line from the top.
Please feel free to like, share, and comment below to let us know about your thoughts, opinions, and/or questions.
Best of Luck!

AC Price Movement PredictionSup all, just publishing my idea of what I believe will happen to AC.
:)

Air Canada 4H Chart analysisCombining the fundamentals (Coronavirus -Travel restrictions) with the current technical chart situation AC couldn't break the triangle from the top.
Short AC at open (ensure doesn't open over the triangle) and hold a short position if closes within the triangle shown above.
Note: Breakout of the triangle towards the top will mean an additional jump back to levels of $35.0 Therefore, set stop-limits at triangle levels.

AC - Resistance AheadReferring to earlier Fibonacci, the price reacted on a resistance level, so this is the reason for a little drop today. However, the price has started picking up on small time frame. This movement is referred to Accumulation period, where insiders started to get in, or in Elliot Wave analysis it is called Wave 1, after wave 1 there will be wave 2 (small retracement) before it could make wave 3 (Public Participation phase where retailers have started to participate upon positive news). However, in technical analysis, Wave 1 is no longer valid if wave 2 drops lower than last low.

AC has made significant Bullish reactionAs posted earlier, AC has rejected significant zone at $12, a selling climax has been identified at Fibonacci level 4.236 and Buying Volume has increases.


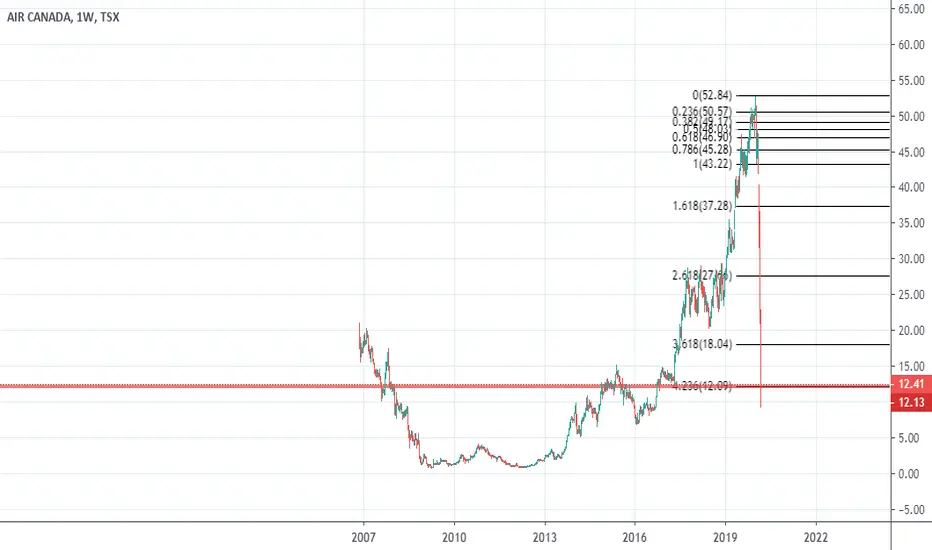
Air Canada 78.6% Fibonacci TestAir Canada chart for follower, JJ Kim. Price has fallen roughly -75% from the all time high in February as global airline stocks have taken an exceptionally hard hit during the coronavirus pandemic as global air travel has witnessed an extreme drop off as countries across the globe shut borders and restrict travel.
Price is currently testing and holding at the 78.6% Fibonacci level of the total range from the 2009 low to the 2020 high. The 78.6% Fib level represents a -78.6% pullback within the total Fib range. As long as price is trading below the 61.8% Fib level the price trend will remain bearish. Best move here is to wait and see if price can regain the 61.8% Fib level before buying, and from there a move back above the 50% fib level is needed in order for price to regain a positive trend. In the immediate short-term, price needs to hold above the 78.6% level to prevent further losses.


The reason for AC bottomedClear technical observation when the price has reached 3.618 and an alert from MACD negative divergence, followed by world wide factor COVID-19. No sign of reversal yet

Crash Landing for Air Canada. Is $4 really possible?I really wish I had bullish news for Air Canada holders but charts indicate we have a high risk of heading not only to sub $10s again but even crash to $4s to recover possibly in the $8s. Buddy's exact words this week with with my double digits daily gains on AC trading: "Pretty ballzy trading AC". 😊 It's actually a good trade if you catch the lows and quickly take profits. Problem is, I'm not the only trader doing this and pro bears are obviously shorting any strength for easy gains on the way down. Bulls are getting exhausted. Planes aren't flying, yes. That's a big problem that will be short lived but what this is doing is changing people's habits FOREVER! People are flocking to videoconferencing via FaceTime, Zoom etc Bears have an easy mauling on this one given the confirmed downtrend on the wider markets and economy grinding to a halt. Enjoy the time off and virtually hug others. We're entering a new era where flying on commercial flights stuffed with other's germs will become highly undesirable. Why travel by plane when there's plenty of places to see in driving distance? Why flight for a business meeting when you can "virtually" connect from anywhere using high speed Internet? Officially neutral since I flip between being bull and bear on this one as soon as the charts tell me to! Not my fault. Looking forward to the amazing seat sales though... I'll still fly (ok, maybe with a hazmat suit on!) Just kidding...

Don't catch a falling knife or falling plane. Fasten seatbeltsWell, if there was any doubts that trading was much better than investing, this recent market correction certainly proves trading outperforms the investment "buy and hold" trainwrecks! Poor little retired investors who just saw their AC investments chopped in The chart I'm providing today is simple since I'm too busy trading that creating fancy charts. It's a day chart. We are seeing a descending triangle setting up for a formidable reversal pattern when the blood stops gushing from this bird. For AC, if you can't read minute charts, best wait for a confirmed reversal before risking a penny here. Not for the faint of heart or rookies. You need very short term trading abilities to make serious money. Wild volatility makes this a very profitable trade without having to risk short selling at or near the short term lows. Seriously oversold RSI of 11 on the day chart and numerous other time scales. Dangerous both long and short. Don't buy and hold. Don't short and hold here...
Ladies and gentlemen, please fasten your seatbelts. The turbulence is far from over in the wider market and in the Canadian skies.
Stay safe and hug your neighbours in a socially distant way!
