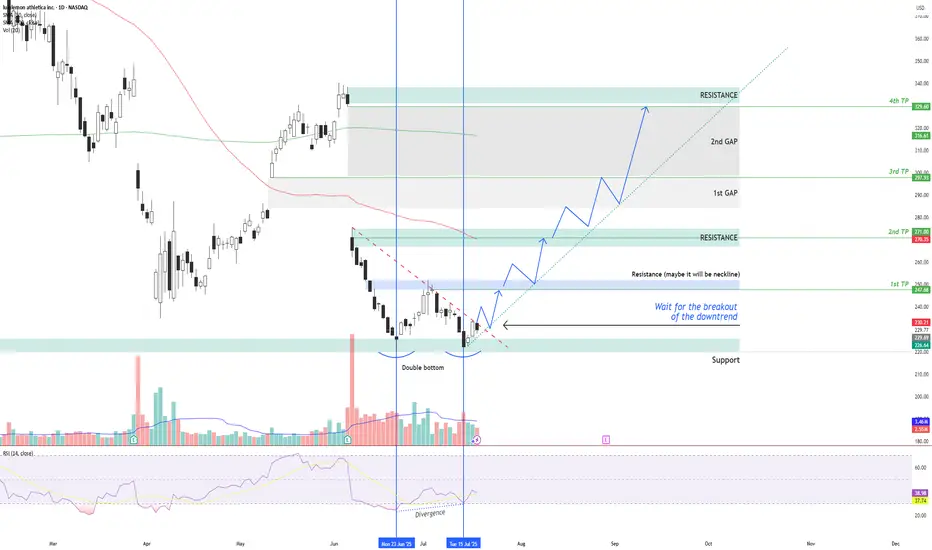
LULU – Double Bottom + RSI Divergence: Multi-Target Setup After LULU NASDAQ:LULU is showing signs of a potential bullish reversal after forming a double bottom structure around the $220 support zone , along with a bullish divergence on the RSI indicator.
Two vertical lines highlight the divergence: while price made a lower low, RSI formed a higher lo
Key facts today
0.68 CAD
2.50 B CAD
14.59 B CAD
About lululemon athletica
Sector
Industry
CEO
Calvin R. McDonald
Website
Headquarters
Vancouver
Founded
1998
FIGI
BBG01LGQ0VG1
lululemon athletica, Inc. engages in the business of designing, distributing, and retailing technical athletic apparel, footwear, and accessories. It operates through the following segments: Company-Operated Stores, Direct to Consumer, and Other. The company was founded by Dennis James Wilson in 1998 and is headquartered in Vancouver, Canada.
Related stocks
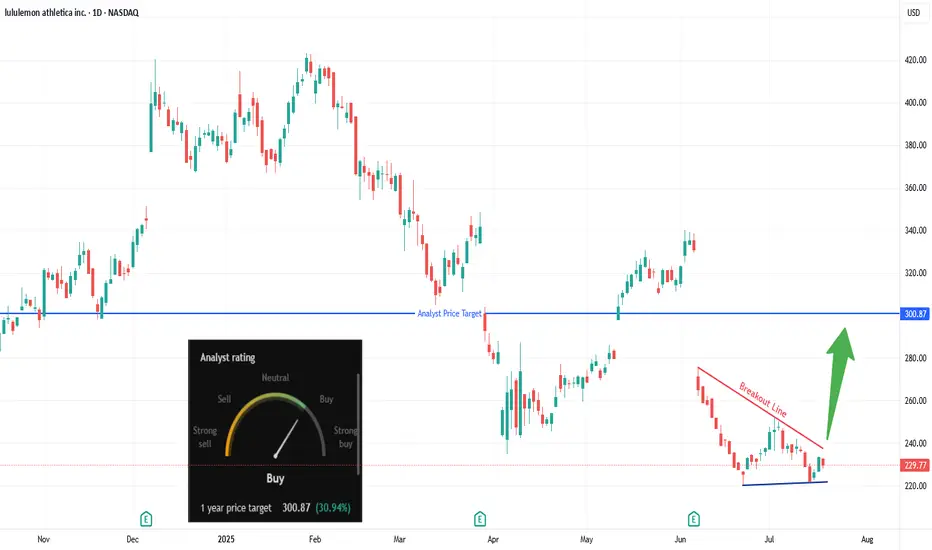
Are Bulls Quietly Loading Up on LULU?Trade Summary 📝
Setup: Descending wedge forming after sharp drop; price testing breakout line.
Entry: Above $240.
Stop‑loss: Below $220 swing low/support.
Targets: $260 , $293–$301 (analyst target).
Risk/Reward: ~3:1 (tight stop, multi-level upside).
Technical Rationale 🔍
Ke
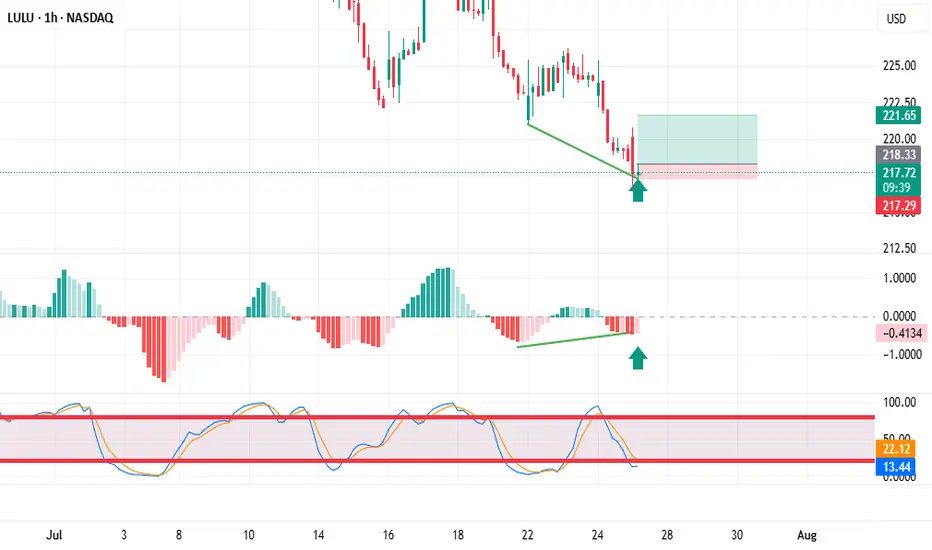
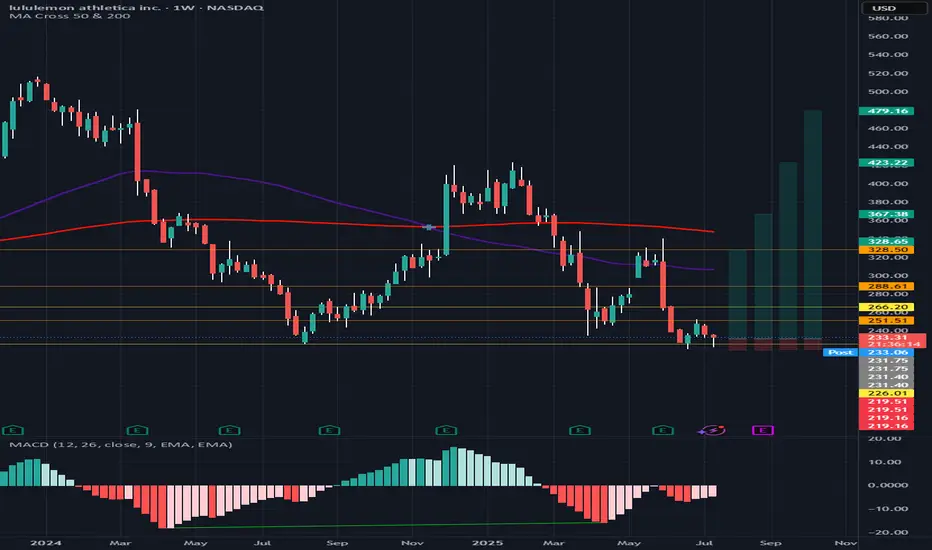
Trading stocks using Dr. Elder's "Three Screen Method"The first thing I do is check the weekly chart. Here I see excellent price divergence relative to the MACD indicator
Then I switched to the daily chart and saw the same excellent divergence as on the weekly chart.
The hourly chart also showed excellent divergence. placed a pending buy order
LULU bullyou see it, we all see it. triple bottom with class A divergence and clear TP and SL, good luck!
Mega-ultra macro LULU takePrice action has "knocked" on the support door FOUR times. It's got to give sometime soon. Fashion brands come and go, I think LULU has had it's time to shine, now it's time for another brand to emerge and take its place.
I say "Mega-ultra macro" to recognize the absurdity of a 6-year guess. The pr
Going to HonoLULULululemon shares fell almost 20% after the company warned tariffs and consumer caution would hurt profits.
Here are some of my bold statements about this:
Tariffs are sector-wide, not Lululemon-specific
Nearly all premium athletic and apparel brands—Nike, Adidas, Under Armour, VF Corp (The

LULU Weekly Bearish Setup – 7/21/2025
📉 LULU Weekly Bearish Setup – 7/21/2025
💥 RSI Breakdown | 📉 Institutional Bearish Flow | 💰 Premium Risk-Reward
⸻
🧠 Multi-Model Consensus Summary
🟥 RSI: Daily 36.1 / Weekly 29.9 – Bearish Momentum Confirmed
📉 Volume: Consistent sell pressure across models
📊 Options Flow: Mixed signals, but bearis

Double Bottom Pattern on LULU“LULU is forming a potential Double Bottom on the daily chart, with two lows around $222 (support) and a neckline at $252. The pattern suggests a bullish reversal if the price breaks above $252 with strong volume. RSI is showing bullish divergence, and the 50-day MA is converging near the neckline,

Stocks SPOT ACCOUNT: LULU stocks my buy trade with take profitStocks SPOT ACCOUNT: NASDAQ:LULU stocks my buy trade with take profit.
Bought at 236 and take profit at 245.
This is my SPOT Accounts for Stocks Portfolio.
Trade shows my Buying and Take Profit Level.
Spot account doesn't need SL because its stocks buying account.

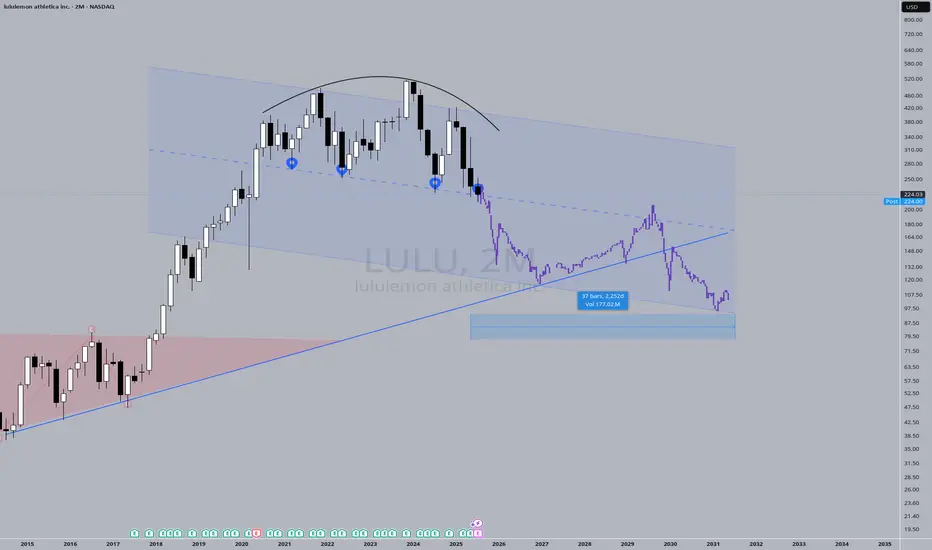
Higher end consumption has officially broken downThe charts of Lululemon, Louis Vuitton, Restoration Hardware & Target are showing significant signs of weakness as all of them have broken important 3M closing support lows. Regardless of what you hear, these charts show that the high end consumer has been slowing consumption for quite some time and

See all ideas
Summarizing what the indicators are suggesting.
Oscillators
Neutral
SellBuy
Strong sellStrong buy
Strong sellSellNeutralBuyStrong buy
Oscillators
Neutral
SellBuy
Strong sellStrong buy
Strong sellSellNeutralBuyStrong buy
Summary
Neutral
SellBuy
Strong sellStrong buy
Strong sellSellNeutralBuyStrong buy
Summary
Neutral
SellBuy
Strong sellStrong buy
Strong sellSellNeutralBuyStrong buy
Summary
Neutral
SellBuy
Strong sellStrong buy
Strong sellSellNeutralBuyStrong buy
Moving Averages
Neutral
SellBuy
Strong sellStrong buy
Strong sellSellNeutralBuyStrong buy
Moving Averages
Neutral
SellBuy
Strong sellStrong buy
Strong sellSellNeutralBuyStrong buy
Displays a symbol's price movements over previous years to identify recurring trends.
Curated watchlists where LULU is featured.
