NEOUSD trade ideas


Wait for the good entry -trade idea- Analysis: If we look at the chart of NEO its obvious that the 50DEMA act as a base (support) for the bullish trend on the daily chart. Right now the current price of NEO is trading above 25$/coin from the average. Right now the best decision that you can made is to wait until the price go down to meet with the average in order to place a low risk long position from near the 75$ level. If the 50DEMA average is going to support the bullish trend the next potential top could be the 300$ level until the next correction or maybe it will be the top of the current bull run. Bitcoin is still hesitating to make another ATH so it will be a chance for NEO as well to test the average as well.
Trade: Buy - wait until market goes down to the 75$ level at least.
Entry: 72-75$
1st target: 150$
2nd target: 290$
S/L: 62$
Consider to join our community to get more of this kind for Free.
community.protradersnetwork.com
#forextrader #forex #forextrading #forexsignals #forexlifestyle #trading #money #cryptocurrency #trader #bitcoin #forexmarket #forexlife #technicalanalysis #stockmarket #forexanalysis #forexmentor #daytrading #forexgroup

NEOUSD has no great strength but can start to riseMy Marketmiracle advisor generated an input signal for NEOUSD for the price of 98.13
The interest of average buyers on NEO is returning, who have been overwhelmed by panic selling.
There is not a big push but you can think of a target of 104.34 .. to begin with.
If you want to see all the Marketmiracle input and output signals, visit marketmiracleadvisor.com is a free service.

NEO continuation patternNEO looks to have completed its corrective structure. Clean 1:1 ratio of A:C. Long this bad boy! GL :)


NEO (NEO) - May 12Hello?
Dear traders, nice to meet you.
By "following" you can always get new information quickly.
Please also click "Like".
Have a good day.
-------------------------------------
(NEOUSD 1W chart)
(1D chart)
We have to see if we can ascend above the 120.28565454 point.
If it goes down, you need to make sure you get support at 109.08891509.
If you decline at 100.25260977, you need a short stop loss.
If you fall at 81.99678728, you need Stop Loss to preserve profit and loss.
However, you can touch the 70.94800755-79.70498226 interval and go up, so you need to trade carefully.
If you gain support and climb in the 70.94800755-79.70498226 section, you can enter the section.
------------------------------------
(NEOBTC 1W chart)
(1D chart)
It remains to be seen if it can rise above the 2133 Satoshi point along the uptrend line.
If it falls, we need to make sure it is supported by the 1963 Satoshi branch.
If it falls at 1309 Satoshi, Stop Loss is needed to preserve profit and loss.
--------------------------------------
It is advisable to trade at your average unit price.
This is because if the price flows below your average unit price, which was on an uptrend or downtrend, there is a high possibility that you will not be able to earn a large profit due to the psychological burden.
The center of every trade starts with the average unit price you start trading.
If you ignore this, you may be trading in the wrong direction.
Therefore, it is important to find a way to lower the average unit price and adjust the proportion of the investment, so that the money that ultimately corresponds to the profit can regenerate the profit.
-------------------------------------------------- -------------------------------------------
** All indicators are lagging indicators.
So, it's important to be aware that the indicator moves accordingly with the movement of price and volume.
Just for the sake of convenience, we are talking upside down for interpretation of the indicators.
** The wRSI_SR indicator is an indicator created by adding settings and options from the existing Stochastic RSI indicator.
Therefore, the interpretation is the same as the conventional stochastic RSI indicator. (K, D line -> R, S line)
** The OBV indicator was re-created by applying a formula to the DepthHouse Trading indicator, an indicator that oh92 disclosed. (Thank you for this.)
** Check support, resistance, and abbreviation points.
** Support or resistance is based on the closing price of the 1D chart.
** All explanations are for reference only and do not guarantee profit or loss on investment.
Explanation of abbreviations displayed on the chart
R: A point or section of resistance that requires a response to preserve profits
S-L: Stop Loss point or section
S: A point or segment that can be bought for profit generation as a support point or segment
(Short-term Stop Loss can be said to be a point where profits and losses can be preserved or additionally entered through installment transactions. It is a short-term investment perspective.)
GAP refers to the difference in prices that occurred when the stock market, CME, and BAKKT exchanges were closed because they do not trade 24 hours a day.
G1: Closing price when closed
G2: Cigar at the time of opening
(Example) Gap (G1-G2)

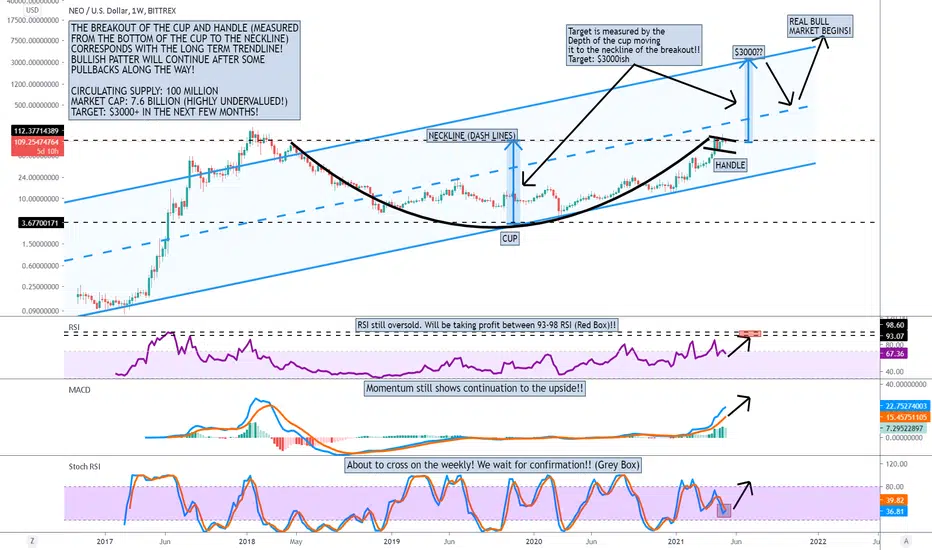
Long-term plan for NEOLooks like a cup and handle forming on NEO. This is how it may play out.
What do you think? Is $3,000 unrealistic?

NEO: Bullish Cup and Handle in the making!! Target: $3000!
Everything is on the chart! NEO is on the verge of exploding higher. Dips/Corrections are normal and needed in a bull market, and are BUYING OPPORTUNITIES! HUGE GAIN opportunity in the coming months!! (Bearish short term!!). On the chart, Stochastic RSI is about to cross on the weekly again. We need confirmation end of the week. RSI is clearly oversold on the weekly! NEVER TRADE BLINDLY. USE MULTIPLE INDICATORS TO MAKE CALCULATED DECISIONS. TRADE WITH NO EMOTIONS!!
CHARTS DON'T LIE!! Small/Mid size Corrections will happen on this journey to $3000+ which corresponds to the Fibonacci target in the next couple of months! Once target is met, a HUGE CORRECTION (maybe 70% dip) will occur. Take profit and buy again for the REAL bull run to begin!
Check out the Altcoin season chart below (Crypto Total Market Cap Excluding BTC ). We are on the verge of another altcoin super cycle
Altcoin Season is just getting started!! BULLISH CROSS on weekly!
Bitcoin dominance will die down and Altcoins will take over!! Whales/bots/institutions will be moving their Bitcoin ( BTC ) into the Altcoins, meaning Altcoin Season is just getting started.
Money flows like this:
FIAT > BITCOIN > LARGE MARKET CAP COINS > MIDDLE MARKET CAP COINS > SMALL MARKET CAP COINS > back to FIAT, and the cycle starts again.
I have moved majority of my BTC and diverse them into different altcoin positions. (ETH, HBAR, GRT , XLM , XRP, NEO, SNX , BNT, BCH, ADA, LTC, BTMX, LINK, FORTH, ENJ, and NKN are the some of the altcoins I am moving BTC too).
Get ready to have an explosive Altcoin season just like what happen in the 2017 bull market. Once my sell indicators hit, I will be selling my positions to buy real estate, a lambo ;) , and moving the rest to Ethereum to Stake it!
Good Luck!
"If you can't beat the fear, do it scared!"
"Be fearful when others are greedy, and greedy when others are fearful!" - Warren Buffet.
"Markets are a device for transferring money from the impatient to the patient. - Warren Buffet
"Show me the charts, and I'll tell you the news." - Bernard Baruch


NEO USD Buy PredictionWe caught Neo on the 1H Support RSI gave a good indicator and we are looking to hold this buy long term


Pullback In A Trend | EMA 10 | EMA 20 | Pin Bar | NEOUSDNEOUSD
Enter at Pin Bar Close. Exit At Previous Swing High For Take Profit. Place Stop Loss At Pin Bar Low. H1 Chart.

NEO bottom $80 in .. road to $120 clear.NEO took a beating recently with the overall crypto shake, but held its ground very well— days below $60 well and truly gone now, and bottom looks to be $80. Assuming no more big tree shakes, NEO should hit $120 again shortly, and test highs of $150. ETH also helping this cause.


NEO need correction I think Neo price will correct to about 70$ in this two month to complete wave 4 .

NEOUSD Bullish Technical Pattern and CandlestickNEOUSD Pennant and Double Bottom and Pin Bar. Pin Bar location is 27 Apr '21, 15:00
Targets are 103.28; 115.96; 133.92


NEOUSD Target Price 103.28 | EMA 10 EMA 20 Pin BarNEOUSD Trade Idea is to enter at 90.61 for a buy opportunity.
