NEOUSD trade ideas


Neo Buy LevelsGood morning people 👍
𝙒𝙤𝙪𝙡𝙙 𝙮𝙤𝙪 𝙡𝙞𝙠𝙚 𝙩𝙤 𝙠𝙣𝙤𝙬 𝙖𝙩 𝙬𝙝𝙖𝙩 𝙥𝙤𝙞𝙣𝙩 𝙩𝙤 𝙗𝙪𝙮 $NEO ?🤑🤑
I teach you easily with a graph , the only thing you have to memorize are the 4 areas drawn with 🟢Green / 🟡Yellow / 🔴Red /⚫Black.
🟩Best entry : 21.50 USD
🟨A good entry : 36.50 USD
🟥Risky entry : 50.75 USD
⬛Danger zone : 12 USD
PD : Black zone is dangerous if the price crossdown this level, it could go down much more. If the price stops on the black line, it is the best possible entry.
PD2 : "Risky Entry" means that it is a more dangerous entry compared to the other 3 colors. But it is a valid entry anyway.
PD3 : Leave me in the comments, what do you want to analyze next. (any crypto/stock/indices )
$BTC $ETHEREUM $ADA $MIOTA $XRP
𝙄𝙛 𝙮𝙤𝙪 𝙡𝙞𝙠𝙚𝙙 𝙞𝙩 𝙤𝙧 𝙞𝙩 𝙝𝙖𝙨 𝙗𝙚𝙚𝙣 𝙝𝙚𝙡𝙥𝙛𝙪𝙡, 𝙮𝙤𝙪 𝙘𝙤𝙪𝙡𝙙 𝙨𝙝𝙖𝙧𝙚 𝙩𝙝𝙚 𝙥𝙤𝙨𝙩 / 𝙘𝙤𝙢𝙢𝙚𝙣𝙩 / 𝙡𝙞𝙠𝙚.
The post would have more visibility so that more people can see it.✅
Check my profile @vbirnoschi !!!


NEO Bullish Price Action to Continue
hi traders:
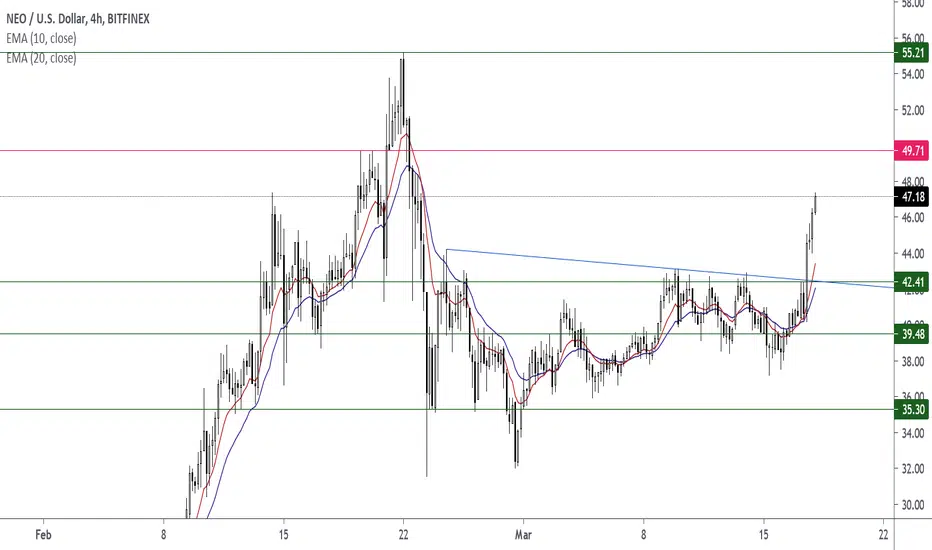
I am also looking at NEOUSD to resume its bullish trend.
We can see there was a strong bullish impulsive phrase to push up the price.
We did see a short term pullback, but it was quickly reverse with a fallen wedge, and LTF continuation bullish price action.
Latest price has formed a continuation correction, and price breaks out now. Expect more bullish price action to form and push the price pass previous highs.
Thank you

NEO (NEO) - March 30Hello?
Dear traders, nice to meet you.
By "following" you can always get new information quickly.
Please also ask for the "Like" clock.
Have a nice day.
----------------------------------
You should watch for any movement that deviates from the 44.19212668-46.91600611 section.
In particular, it remains to be seen if it can rise above the 50.22168635 point.
If it falls, you need to make sure you get support at 40.95031112.
If you fall at 40.95031112, you need a short stop loss.
If supported at 50.22168635, the uptrend is expected to accelerate.
------------------------------------
(NEOBTC 1D chart)
We have to see if we can get support at the 758 Satoshi point and climb above the 914 Satoshi point.
In particular, it remains to be seen if it can rise along the uptrend line.
If it rises above the 868 Satoshi point and gains support, it is expected to turn to an upward trend.
-------------------------------------------------- -------------------------------------------
** All indicators are lagging indicators.
So, it's important to be aware that the indicator moves accordingly with the movement of price and volume.
Just for the sake of convenience, we are talking upside down for interpretation of the indicators.
** The wRSI_SR indicator is an indicator created by adding settings and options from the existing Stochastic RSI indicator.
Therefore, the interpretation is the same as the conventional stochastic RSI indicator. (K, D line -> R, S line)
** The OBV indicator was re-created by applying a formula to the DepthHouse Trading indicator, an indicator that oh92 disclosed. (Thank you for this.)
** Check support, resistance, and abbreviation points.
** Support or resistance is based on the closing price of the 1D chart.
** All explanations are for reference only and do not guarantee profit or loss on investment.
Explanation of abbreviations displayed on the chart
R: A point or section of resistance that requires a response to preserve profits
S-L: Stop Loss point or section
S: A point or segment that can be bought for profit generation as a support point or segment
(Short-term Stop Loss can be said to be a point where profits and losses can be preserved or additionally entered through installment transactions. It is a short-term investment perspective.
GAP refers to the difference in prices that occurred when the stock market, CME, and BAKKT exchanges were closed because they do not trade 24 hours a day.
G1: Closing price when closed
G2: Cigar at the time of opening
(Example) Gap (G1-G2)


neo 3.0 2021 update Neo 3.0 2021 update
corr needed
But a Chart aims is on a way up!
Cheers. Be rich


NEO ATH TestGood day Traders. Neo the hidden gem with a diamond bottom will test ATH within the next month or so, Its busy gearing up for a big move. Not financial advice, just my thoughts right now. Please leave a like if you agree. Or let me have your thoughts below. Cheers for now.


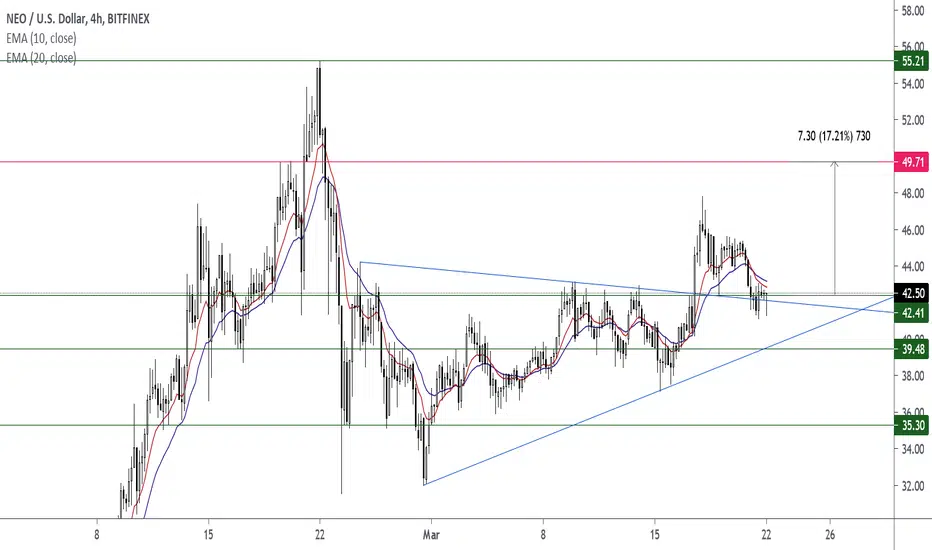
Head and Shoulders pattern NEOUSDT
BINANCE:NEOUSDT
Expecting a head and shoulder move with retraction to approx 42.50 after which it should move to the level of the shoulders at approx 44.00. Looking at 15 minute chart.

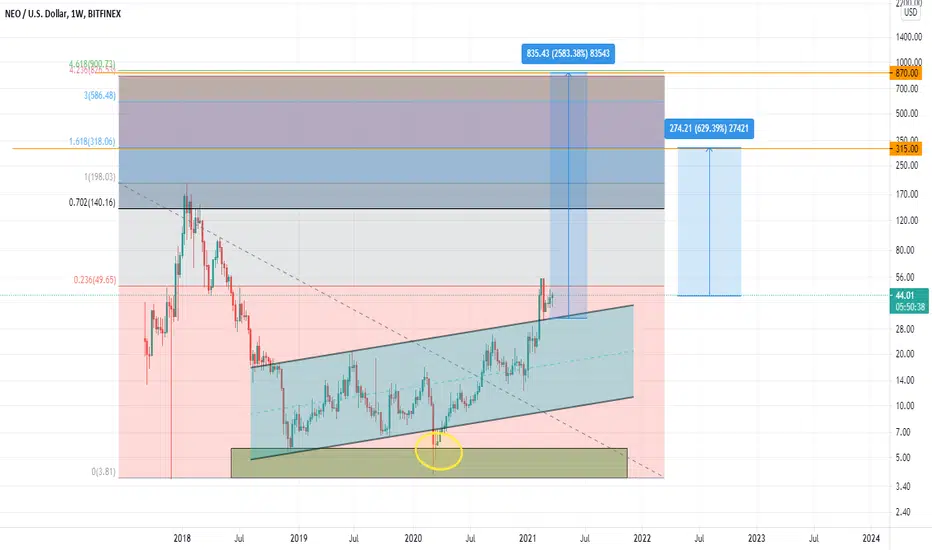
NEOUSD Heading toward previous 2018 Resistance/SupportWith upcoming 3.0 NEO and previous highs I think we could be moving to the $86 range next. From what I can see the volume is steadily increasing which supports the accumulation and likely move higher. What do you guys think?

NEO vs BTC when Alt Season Starts Fib ExtensionsThis is a very rough idea. If we repeat a similar alt season to early 2018 we could potentially use fib extensions on alts to predict ATH based on current BTC ATH since the alts trailed BTC's trend in the last major bull cycle. Current BTC is sitting around 60k, which if you look at the fibs is a little over 300% increase on the 2017 spike. If you apply the same principle to NEO and look at where the 300% mark is, you will see it is somewhere around the $700 mark. This may of course even be a low projection, since alts often have the tendency to multiply greater than btc.

