Bullish on NEO. Again. NEOUSDHere is a 1st. 2nd waves of a fractal confirmed. I believe this is a beginning to a new impulse wave for NEO. Again, NFA, and again, too early to call Fib targets.
NEOUSD trade ideas


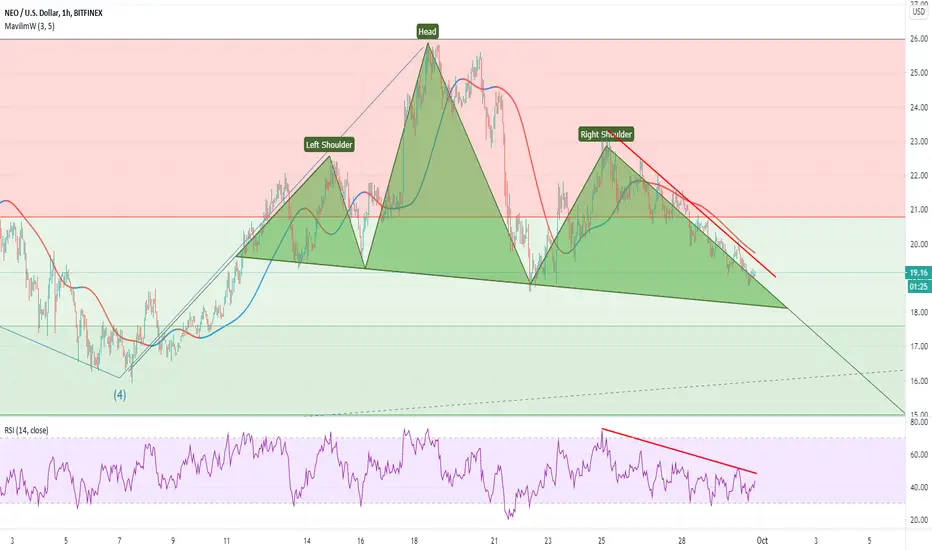
NEO/USD formation and potential tradesHello, Traders!
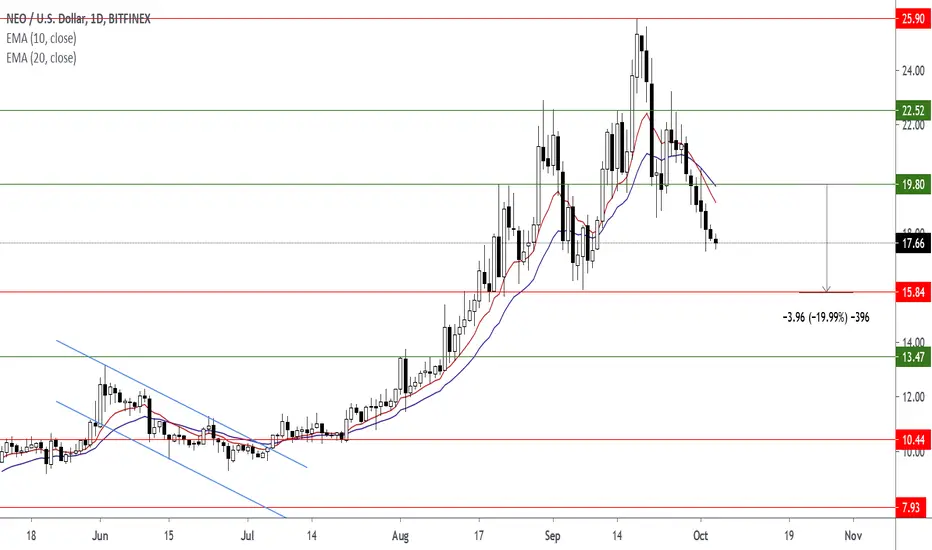
NEO has seen interesting price action since September, showing little correlation towards the rest of the cryptocurrency market, particularly at the end of September. Since the September peak when NEO reached nearly $26 USD, NEO has seen a 30% price decrease.
From the mini-run seen at the start of the year, NEO was unable to break the $17.5USD resistance level. NEO bounced off it and headed towards $4 USD. From August the $17.5 USD level has acted as support four times, showing the current strength of this level and the unlikelihood that NEO will fall below $17.5 USD
The recent descending wedge breakout from NEO has clearly occurred. However it has been followed by a period of sideways trading. The likelihood of this being a true breakout is high. This is due to the number of confirmation points being high (6), on the downwards resistance line from the descending wedge.
NEO is currently sideways trading, as shown below with the green box. If this box is broken above (which seems most likely) the next level which NEO will be aiming for is $20 USD.
In conclusion the indicators for NEO are bullish. According to the indicators this means that NEO is unlikely to fall below the $17.5 USD level. NEOs next stop is $24USD in a bullish scenario, while in a bearish scenario expect NEO to hit just over $14 USD.
Watch out for the market and good luck!


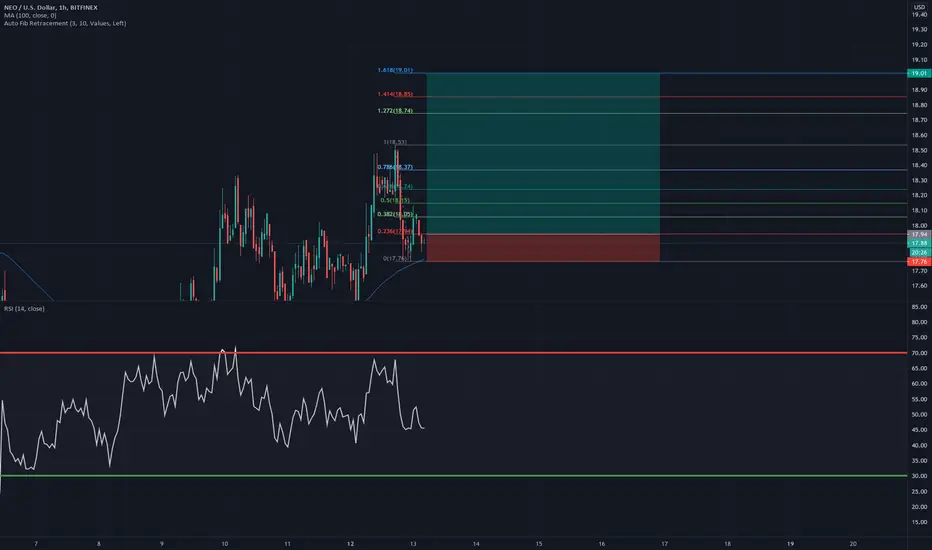
NEO USDIf NEO can reclaim 19 USD and close a daily candle above 19, this zone can be flipped to support and we can see a move towards 19.6, 21.8 and 23.6. Stop loss should be place around 18.
If we are not able to break the resistance of 19, we can open a short with a stop loss around 20 and a target price below 17 USD.

What is NEO? The cryptocurrency for the smart-economy!!!Neo has been one of the favorite cryptocurrrency for crypto-enthusiastic. So, Neo has the distinguished cryptocurrency in the past bull run on 2017 when the maximum that NEO reach up was of $207 USD. So, I believe that this crypto have future in medum to long-term. But, what did this cryptocurrency so different for others cryptos?
But, What is NEO?
1. NEO it's an open networkfor the smart economy. The NEO ecosystem is driving with the large community of enthusiastic and developer to become this cryptocurrency for the next-generation of the internet.
2. NEO is an open-source, community driven platform that is leveraging the intrinsic avantages of blockchain technology to realize the optimized digital world of the future.
3. Another features is that NEO is investing $100 million through its ecoboost program to accelerate the realization of large-scale commercial blockchain solutions by empowering developers and proyects in the ecoystem all funding.
Use of Case:
a) Blockchain infrastructure: You can to contribute to the underlying infrastructure of the NEO Blockchain.
b) Digital Asset: You can digitize assets in a decentralized, secure and third party free fashion.
c) DEFI: You can to transform traditional financial instruments into trustless and transparent protocols
d) Game: You can to empower new game of gaming experience by integrating blockchain features.
My Personal Opinion:
NEO it's another cryptocurrency that I have in my radar together with Chainlink too. But talking about NEO, they wan't to built a strong infrastructure to develop smart contract based in the economy digital solution. The most interesting what I found out is that based in my entrepresenurship and NEO proyect that they goal is to resolve and create the smart-economy for us and resolve all problems in our life facet. I see that my proyect based in to create a digital world for the next economy revolutionary that we could to trade assets, create tokens or assets, pay using these tokens and make this token to diluted the inflation as NEO grow up, I want that this token of value assets grow up too. That could be a good solution for my proyect that I want to develop. Also, all my idea is published in my past fundamental analysis of Enjin Coin. But, what I found out on NEO is so perfect for my Dapp to create your own blockchain empire and decentralized world that we could to trade, and also, that proyect I want to build based in the DEFI proyect that it's about to trade assets in the digital world to resolve all problems in fact to create a assets kinds that people or enhusiastic could to trade, make DEFI business and create the next generation revolutionary. So, in genral, I like NEO as investment and become a NEO developer in the future.
For more resources, please visit these links:
1. NEO Website: neo.org
2 . NEO Twitter: twitter.com

NEO turns around. NEOUSDAnd appears to have reached peak of Wave 3 - now looking for a bit of retrace. Still a wave 5 to go and then a bigger retrace. We are moving up, just lagging a bit fractally from some of the other coins. I am putting entries at the deep retrace levels. For the noobs, a) this is not now b) not financial advice.

Chinese version of Ethereum- Neo is ready to Pump!!!Neo is like the Chinese version of Ethereum. It’s currently plowing ahead with a massive overhaul, called Neo3, which will make Neo faster, more secure, and more efficient.The Neo team also recently launched Flamingo, a full suite of DeFi tools built on the Neo network.
Flamingo is like Yearn.Finance, Compound, Maker, Synthetix, Perpetual trading, Ren, Curve, and Uniswap all rolled into one. If you don’t know what each of those projects do, don’t worry. Just know Flamingo is built as the first full-stack DeFi services protocol.
According to Flaming Finance, the crypto community was so excited about the platform’s launch that $1.6 billion worth of assets flowed into the network by the end of September. And much of this influx was thanks to Neo’s Poly Network alliance.
The Poly Network is a new protocol alliance formed to facilitate cross-chain transactions between blockchains without needing to issue new tokens. Neo, Ethereum, Ontology, and Cosmos are part of this alliance, and there are plans to add bitcoin as well.
Flamingo’s launch is a massive endeavor in the sense that there is currently no one-stop solution built on top of Ethereum. And Flamingo will be a game-changer for NEO token holders as more assets are pulled from Ethereum to its platform.


$NEO - Break of Structure - Pullback to a new highLooks like NEO just barely broke the swing high after hitting resistance and bouncing back. Look for a retracement for a long around 16.85. This is a 4 hour chart so you might be able to pull in some good shorts if you find the right setup on a 15 min time frame. Like if you can keep finding patterns like these on the way down, why not sell too?

NEOUSD H16: BEST Level to SHORT IT 30% gains(SL/TP)(NEW) Why get subbed to me on Tradingview?
-TOP author on TradingView
-15+ years experience in markets
-Professional chart break downs
-Supply/Demand Zones
-TD9 counts / combo review
-Key S/R levels
-No junk on my charts
-Frequent updates
-Covering FX/crypto/US stocks
-24/7 uptime so constant updates
NEOUSD H16: BEST Level to SHORT IT 30% gains(SL/TP)(NEW)
IMPORTANT NOTE: speculative setup. do your own
due dill. use STOP LOSS. don't overleverage.
Tagged as LONG as I expect more upside
before reversal BEARS at 22.00 USD.
🔸 Summary and potential trade setup
::: NEOUSD 16hour chart review/outlook
::: speculative H*S setup in progress
::: requires confirmation
::: LONG/SHORT sequence
::: but lower risk on sell side later
::: RS near 22 USD best level to short it
::: neckline of pattern at 16 USD
::: previously rejected at 25 USD
::: TP BEARS is 30% gains
::: BULLS may buy now, but more risky
::: TP bulls is 22 USD
::: recommended strategy: SHORT IT / SHORT rips/rallies
::: ENTRY NEAR 22 USD SL 24USD TP 16USD
::: SWING TRADE: SHORT HIGH near RS
::: correction not over yet
::: good luck traders!
::: SHORT and get paid. period.
🔸 Supply/Demand Zones
::: N/A
::: N/A
🔸 Other noteworthy technicals/fundies
::: TD9/Combo update: N/A
::: Sentiment mid-term: BEARS/16USD
::: Sentiment outlook short-term: BULLS

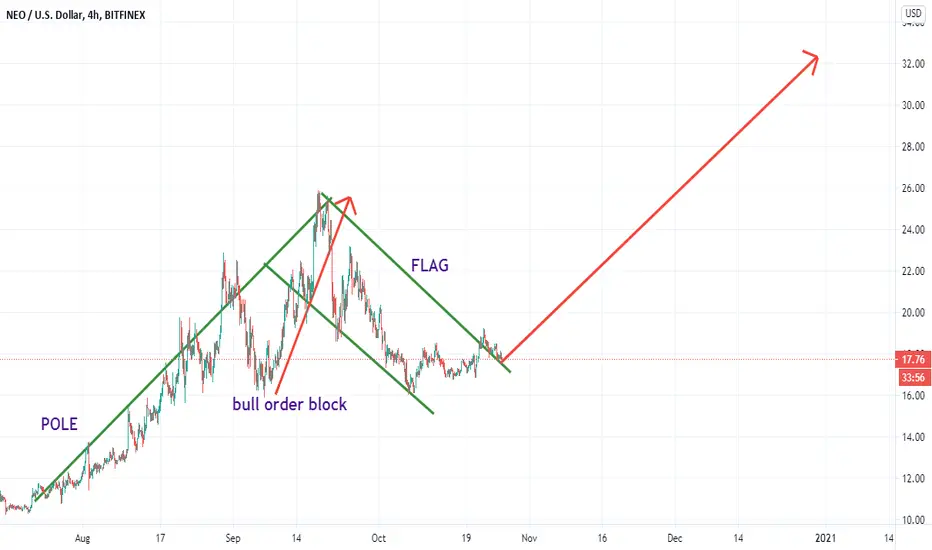
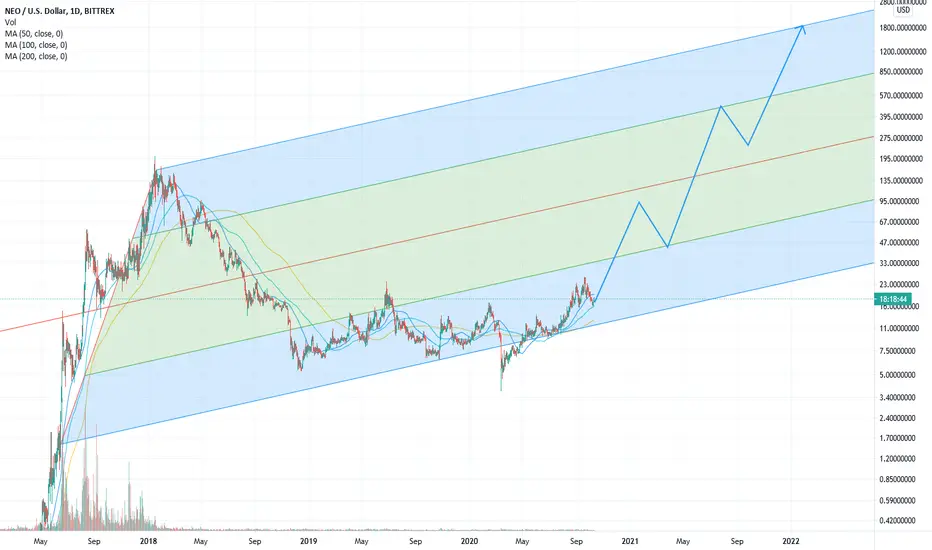
NEOUSD: Possible Long (11.10.2020)On D1, the price touched the lower border of the ascending channel on a logarithmic scale. The RSI has almost reached an oversold level near the 50% Fibonacci level.
On H4, the price broke through the border of the descending channel upwards, and divergence was formed between the price and the RSI. Also, the first impulse movement towards the NEO price increase is visually visible.
We recommend buying NEO to keep the position above 26.


NEO broke the Floor. NEOUSDYup, we're going South. Some Fib targets off the latest zigzag are shown.


Neo ready for another Push. NEOUSDI believe we bottomed out on Wave 4 at this current junction. I have indicated where I believe Wave 5 might reach at minimum. Other than that, RSI looks rather oversold. NFA.