NEOUSD trade ideas
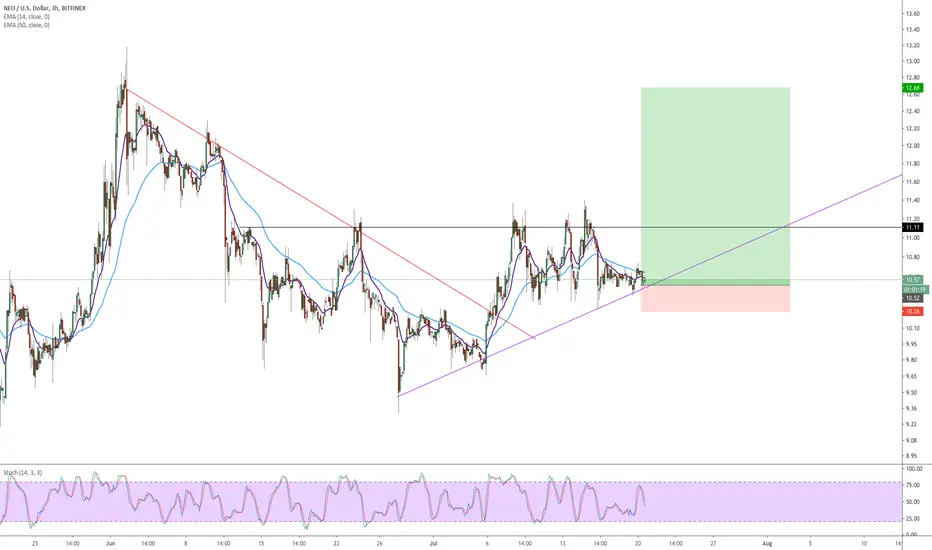
NEO/USD Strong potential for bullish movement - LONG!!NEO/USD has developed a strong ascending support on the 2H (dark blue line).
Facing some resistance on the 1H (light blue line), however this is expected as it was previously a support when it crashed from $16 to $3.
It is also breaking out of a larger triangle on the weekly.
The fibonnaci retracement and expansion levels match perfectly, and are useful when helping us decide our take profits.
TP1 = 11.91 (always take profit before strong psychological numbers, or even numbers, as this is when other holders are likely to cashout, and your take profits will not be met).
TP2 = 14.20
TP3 = 16.82 (recent high plus matches perfectly with our analysis).
TP4 = 100+
With an ATH of $198, Neo is not even close to reaching its potential. As long as Btc stays stable or rises, Neo should follow suit, even pulling ahead, to catch up to its past.
Due to the strong support created, the accumulation zone right now would be around 9.50-10.8, perfect time to buy to get maximal returns. Going long could yield some serious results.
As always, any comments or advice on the analysis used is greatly appreciated, and encouraged.

NEOUSD D1: upside limited 20%+ correction UP NEXT(NEW)Why get subbed to to me on Tradingview?
-TOP author on TradingView
-15+ years experience in markets
-Professional chart break downs
-Supply/Demand Zones
-TD9 counts / combo review
-Key S/R levels
-No junk on my charts
-Frequent updates
-Covering FX/crypto/US stocks
-24/7 uptime so constant updates
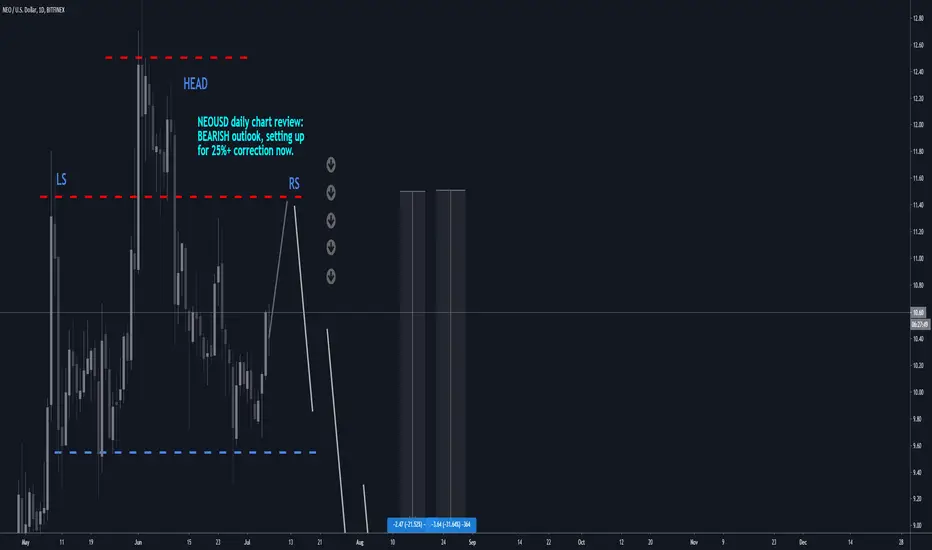
NEOUSD D1: upside limited 20%+ correction UP NEXT(NEW)
IMPORTANT NOTE: speculative setup. do your own
due dill. use STOP LOSS. don't overleverage.
🔸 Summary and potential trade setup
::: NEOUSD daily chart review and outlook
::: not a trade setup / warning only
::: speculative H&S setup / BEARS
::: limited upside from here
::: RS /LS symmetry at 11.45
::: strategy: STAY OUT / SHORT IT
::: nice symmetry and likely leads to correction
::: up to 20%/25% losses next 4-6 weeks
::: so recommend to stay out of this market
::: good luck traders
🔸 Supply/Demand Zones
::: supply/demand: N/A
🔸 Other noteworthy technicals/fundies
::: TD9 /Combo update: N/A
::: Sentiment short-term: BULLS
::: Sentiment outlook mid-term: BEARISH

NEOUSD long idea, NEOUSD alis fikriWe see NEO as it is forming up the 5th wave up.
NEO nun 5. dalgasina hazirlandigini goruyoruz.

EW Analysis: NEOUSD Can See A Deeper Corrective DeclineHello traders!
Today we will talk about cryptocurrencies, specifically NEO and its price action from Elliott Wave perspective.
NEOUSD made an impulsive five-wave cycle from March lows, which suggests a bullish reversal at least in three waves A/1 - B/2 - C/3. Since the beginning of June, seems like NEO is making a three-wave a-b-c correction, where wave "c" is still missing. So, don't be surprised if we see another decline towards projected 8.0 - 6.0 support zone around important 61,8% - 78,6% Fibonacci retracement and this is where a higher degree wave B/2 correction may come to an end, which can be followed by strong and impulsive bounce back to highs for wave C/3. In case if we see something deeper and more complex, invalidation level remains at 4.0!
Be humble and trade smart!
If you like what we do, then please like and share!
Disclosure: Please be informed that information we provide is NOT a trading recommendation or investment advice. All of our work is for educational purposes only.

Don't miss the great buy opportunity in NEOUSDTrading suggestion:
. There is a possibility of temporary retracement to suggested support line (9.59874). if so, traders can set orders based on Price Action and expect to reach short-term targets.
Technical analysis:
. NEOUSD is in a range bound and the beginning of uptrend is expected.
. The price is above the 21-Day WEMA which acts as a dynamic support.
. The RSI is at 52.
Take Profits:
TP1= @ 12.55810
TP2= @ 14.50133
TP3= @ 16.87258
TP4= @ 20.61120
TP5= @ 24.30101
SL= Break below S2
❤️ If you find this helpful and want more FREE forecasts in TradingView
. . . . . Please show your support back,
. . . . . . . . Hit the 👍 LIKE button,
. . . . . . . . . . . Drop some feedback below in the comment!
❤️ Your Support is very much 🙏 appreciated! ❤️
💎 Want us to help you become a better Forex trader ?
Now, It's your turn !
Be sure to leave a comment let us know how do you see this opportunity and forecast.
Trade well, ❤️
ForecastCity English Support Team ❤️

NEO going downNEO is near strong resistance confluenceing with multiple signs:
crossing 2 daily TL with resistance level and fib ret level forming nice H&S pattern
T - 7$

NEOUSD D1: 25% correction UP NEXT / don't get caught up(NEW)Why get subbed to to me on Tradingview?
-TOP author on TradingView
-15+ years experience in markets
-Professional chart break downs
-Supply/Demand Zones
-TD9 counts / combo review
-Key S/R levels
-No junk on my charts
-Frequent updates
-Covering FX/crypto/US stocks
-24/7 uptime so constant updates
NEOUSD D1: 25% correction UP NEXT / don't get caught up(NEW)
IMPORTANT NOTE: speculative setup. do your own
due dill. use STOP LOSS. don't overleverage.
🔸 Summary and potential trade setup
::: NEOUSD 2D chart review and outlook
::: not a trade setup / warning only
::: speculative H&S setup / BEARS
::: limited upside from here
::: RS/LS symmetry at 11.45
::: strategy: STAY OUT / SHORT IT
::: nice symmetry and likely leads to correction
::: up to 25% losses next 4-6 weeks
::: so recommend to stay out of this market
::: good luck traders
🔸 Supply/Demand Zones
::: supply/demand: N/A
🔸 Other noteworthy technicals/fundies
::: TD9/Combo update: N/A
::: Sentiment short-term: BULLS
::: Sentiment outlook mid-term: BEARISH


NEOUSD 4D: Potential bullish setup 100% gains (SL/TP)(NEW)Why get subbed to to me on Tradingview?
-TOP author on TradingView
-15+ years experience in markets
-Professional chart break downs
-Supply/Demand Zones
-TD9 counts / combo review
-Key S/R levels
-No junk on my charts
-Frequent updates
-Covering FX/crypto/US stocks
-24/7 uptime so constant updates
NEOUSD 4D: Potential bullish setup 100% gains (SL/TP)(NEW)
IMPORTANT NOTE: speculative setup. do your own
due dill. use STOP LOSS. don't overleverage.
Tagged as SHORT because I expect more short-term
losses before reversal (BULLS).
🔸 Summary and potential trade setup
::: NEOUSD 4daily chart review
::: Speculative bullish setup
::: more losses short-term
::: 8.00/8.20 reload point bulls
::: 100% gains possible from my level
::: strategy: BUY LOW 8.20
::: TP bulls is +100% gains BUY/HOLD setup
::: buy low near my level and get rewarded
::: TP bulls is 16.00/18.00
::: but reversal soon after from my level
::: good luck traders
🔸 Supply/Demand Zones
::: dem/supp N/A
🔸 Other noteworthy technicals/fundies
::: TD9/Combo update: N/A
::: Sentiment short-term: BEARS
::: Sentiment outlook mid-term: BULLISH

NEOUSD: Analysis using Ichimoku 30/06/2020H4
On D1, the cloud is directing downward, indicating a downtrend.
Conclusion:
Locally, we recommend selling when the RSI reaches an overbought on H4.
H1
At H4, the cloud is directing upward, indicating an uptrend. At H1, the cloud is directing upward, indicating the movement within the framework of the trend for H4.
Conclusion:
Locally, we recommend buying when the RSI reaches an oversold level at the local price correction.


NEOUSD | A Possible Bullish ReversalHi friends hope you are doing well and welcome to the new update on Neo coin. As the Neo coin has broken down the support of an up channel that was formed on the daily chart same as like the Bitcoin has broken down the channel. In today’s post we will try to understand now what can be happen next whether the price action will move up or move down.
Breaking down the channel and a golden cross:
As we have already discussed that the priceline of Neo coin has broken down the support of the channel. The formation of this channel was started after the mid of March 2020. On 7th June a golden cross between 50 simple moving average and 200 SMA.
This golden cross produced a powerful rally that leaded the price action up to the resistance of the channel. However after making a powerful attempt to break out the resistance the priceline moved back to hit the support of the channel and finally it has broken it down. At this time the price action is breaking down the 50 simple moving average once this moving average will be broken down then Neo can hit the 200 SMA. The golden cross formation is below the price action therefore unless this golden cross will be not changed to the death cross there will be a hope for the bullish reversal of price action.
Support and resistance levels:
Now if you watch the different support and resistance levels on 2 day chart then it can be observed that after mid of march the price action turned bullish and produced more than 125% rally. And reached at $13 resistance. That is really very strong resistance as it is not broken out since after July 2019. Once the price action broke out this level. But while retesting this resistance as support it was failed. At that time all the markets were moving down. And the Neo coin also moved down with other markets as well. After hitting the last support at $6 it produced more than 125% rally and after breaking out every resistance level it has been retesting the every resistance as support. At this time after hitting the $13 resistance and being rejected it is again dropped at $10 support. If the price action will be not able to retain this support then it can move to the next support at $8.
Formation of bullish reversal pattern:
Even though the price action has broken down the support of up channel on the daily chart. But at the same time the Neo coin has formed a bullish reversal pattern and that is harmonic BAT. The price action has just spiked into the potential reversal zone. This PRZ starts from $10 up to $9.65. Now we can set our stop loss the maximum extent of this bullish BAT pattern’s PRZ level. Because if the potential reversal zone will be broken down then the priceline move more down to form a bullish Crab’s final leg.
Ichimoku cloud:
Now at the end of this article I would like to share a very important move of Neo coin that can be appeared in the near future. And that is the ichimoku cloud on the long-term weekly chart. As we can observe that the Neo coin never able to cross up this cloud and now it is continuously making several attempts to break out this cloud. After making the recent attempt it is moving down but we have still lagging span of the ichimoku cloud above the price action that is a bullish signal. And the conversion line is crossing up the baseline just below the price action. That is another bullish signal. Now if the price action will take a powerful bullish divergence from the potential reversal zone of BAT pattern that is formed on the daily chart. Then it might be helpful for the priceline to break out this cloud and once this cloud will be broken out then it will become a very strong support for the long term bullish rally.
Conclusion:
On weekly chart after hitting the ichimoku cloud the price action is moving down. And it has also broken down the up channel. And it has also formed a bullish reversal pattern. Therefore the unless the potential reversal zone of this BAT pattern will not be broken down we can hope for a powerful bullish reversal from here.

NEOUSD, Broken rising channel...simple rising channel with expected final target of 5.78 (almost the long-term bottom, which can be a good buy opportunity).

NEOUSD: Analysis using Ichimoku 19/06/2020H4
At D1, the Ichimoku cloud is directing upward, indicating an uptrend. On H4, the cloud is directing downward, indicating the formation of a correction for D1.
Conclusion:
We recommend buying when the RSI reaches an oversold level on the H4 and selling when the RSI reaches the overbought.
H1
At H4, the cloud is directing downward, indicating a downtrend. At H1, the cloud is directing downward, indicating the movement within the framework of the trend for H4.
Conclusion:
We recommend buying because the price went beyond the downtrend at H4, while the RSI on the H1 has reached the level of oversold.
We also recommend selling when the RSI reaches the overbought level on the H1 and H4.
Good luck!

On #NEO, as on #XLM, the move down from the top is a very cleanGiven the slope, it doesn't seem to be wave C of a flat -> more downside in perspective


NEO LONG TERM STRATEGY!!! Neo inside the channel for almost 2 years. A lot of the large cap Altcoins have the same pattern. they have been trading within this channel for a while. Once NEO breaks the upper line of the channel the move will be violent. I will not be surprised if we see a $1000 Neo 2021-2022. Happy Trading!!


NEO-USD LONG TRADE SETUPPlease manage your risk. Use Stop loss. And do not take blind entries.
If you have question let me know. If you want to analyze any pair let me know.
This is just an idea. What we see.
Market can go in the opposite direction, what we analyze. so we have to manage our risk and adopt the situation accordingly.

NEOUSDHello, On the NEOUSD weekly chart - NEOUSD is close to a T.K cross. On the previous T.K cross, NEOUSD expanded over 100%. This could see NEOUSD, rise further, over the coming weeks. Not advice.
