NEOUSD trade ideas

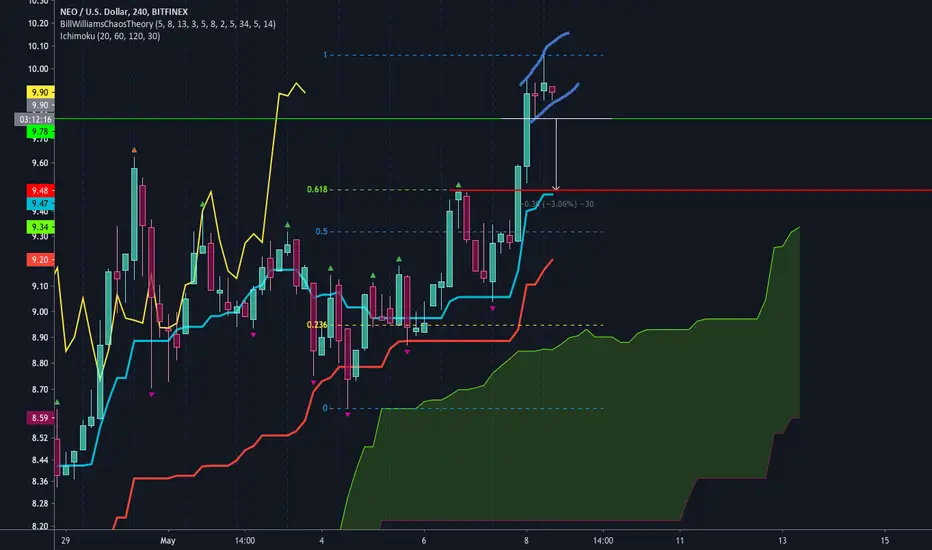
NEO: Analysis using Ichimoku 06/06/2020H4
A rising channel is visually recognized, the borders of which the price is currently testing.
The NEO price is trading on the Ichimoku cloud, indicating the presence of a local correction.
RSI is directed towards to level of oversold.
Conclusion:
We recommend buying from a key support level of Fibonacci 50%.
H1
The price is trading below the Ichimoku cloud, indicating the zone of the possible completion of the correction.
RSI is overbought, indicating sellers are weak.
Conclusion:
We recommend buying from a key support level of Fibonacci 50%.
Good luck!

NEOUSD | A Possible Move To $200Hi friends hope you are doing good and welcome to the new update on Neo coin. In today's article will see how the Neo coin has turned bullish after the formation of very big bullish harmonic pattern. And now what next and how the price action will behave.
Big bullish Shark pattern has done its job:
In my previous article on NEO that I published on April 2020. I revealed that the price action of Neo coin has formed a very big bullish Shark pattern on two week chart. And the final leg of this pattern was completed in the month of March when the Neo and all other cryptocurrencies even the complete market was facing very strong bearish trend. And this strong bearish rally helped the Neo coin to complete this final leg. And as per Fibonacci sequence of bullish Shark pattern I predicted that because the price action has entered in the Fibonacci retracement 0.886 to 1.13 Fib level. Therefore now the Neo coin will turn bullish from here and it will be entered in the Fibonacci projection of C to D leg from 0.382 to 0.786 Fibonacci projection. And as per prediction that I made on the basis of the Fibonacci sequence of this pattern the price action finally turned bullish and so far it has produced more than 130% bullish rally.
SMAs are showing bullish move that can breakout the channel:
After starting the bullish move the price action of Neo coin has formed an up channel on the daily chart. And during the movement in this channel we have seen two major attempts by the price action to break out the channel. 1st attempt was made in the second week of May and second attempt was started from the 1st June and even at this time price action is trying to breakout the resistance of the channel. And if we watch the simple moving averages with the time period of 50 and 200 on the same daily chart then we have a very positive move by these moving averages as 50 simple moving average is moving up to form a golden cross with 200 SMA. If this golden cross will be formed then the price action will have a strong support of these two simple moving averages. And this cross can produce more powerful rally that can help the priceline to breakout the resistance of this up channel.
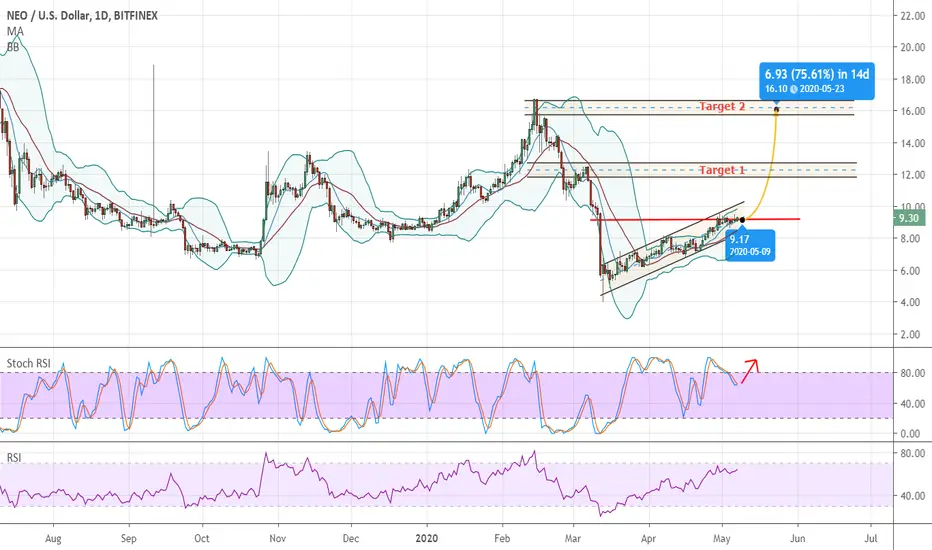
Wedge formation and bullish signals by exponential moving averages and Bollinger bands:
Now let's switch to the weekly long-term chart. And here it can be easily observed that the price action of Neo has formed very big wege pattern on this weekly char. The formation of this pattern was started from November 2019 and sincethen the price action is not able to break out from this pattern. And this time the price action has again geared up and reached at resistance of the channel to break out. This time we have two major positive signals for the breakout. 1st signal is the bollinger bands is moved above the resistance of this wedge. Therefore this time the priceline will not face the resistance of the bollinger bands as it has been facing previously while making the previous attempts for the breakout from this wedge. And the second positive signal is that a bull cross is formed between the exponential moving averages with the time period of 10 and 21 just beneath the priceline. That can be also very helpful for NEO to breakout from the resistance of the wedge. However if we watch the volume profile of the complete priceline moving within this pattern. Then we have the trader’s interest upto the support and while moving upward the volume profile is showing that trader’s interest is upto $11.5. And at this time the price action is at the area where the trader’s interest is weak, however the support of exponential moving averages and the position of the bollinger bands can help the priceline to break out from the resistance of this wedge.
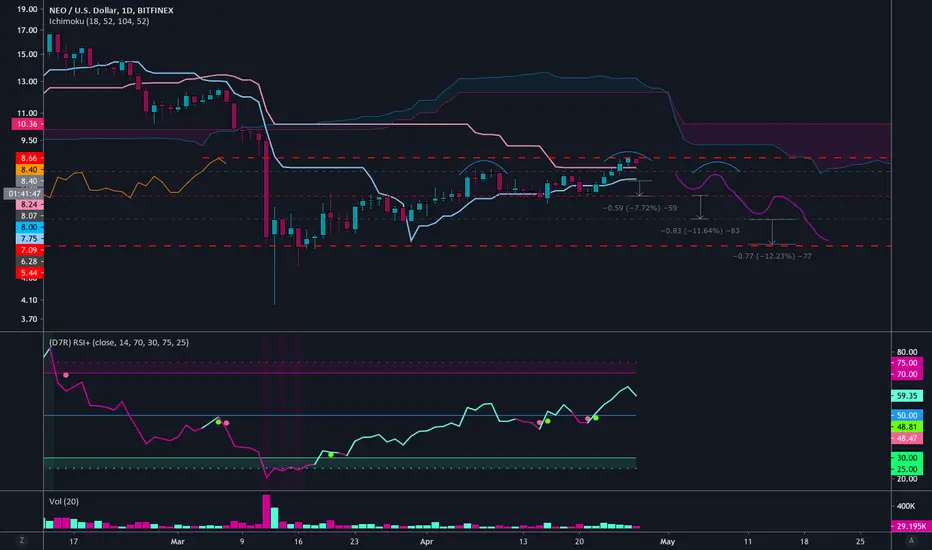
Ichimoku cloud:
Now I would like to draw your attentions towards a very important indicator and that is Ichimoku cloud. And on the chart it can be easily seen that the price action never able to break out from this cloud on the weekly chart. From June 2019 we have witnessed several attempts by the priceline to hit this cloud but so far all attempts are unsuccessful. At the moment the cloud is very weak and the price action has hit the cloud again for another try to cross up. At this time the resistance of the cloud is at $13 where the price action has already spiked. If we watch the lagging span of the cloud then it is turned bullish and it has crossed up the candlesticks. And the conversion line is moving up to cross the baseline once this cross will be completely formed then we can see the cloud will be turned bullish (green color). And the candlesticks can cross up this is bullish cloud very easily. Once this cloud will be broken out then it will become a very strong support for the NEO coin that will lead to a very long term strong bullish rally.
Let’s talk about the key level resistance:
Now If talk about the different long term resistance levels for the Neo coin. Then Neo has very strong resistance at $13. This resistance has not been broken out since after December 2018. Once it was broken out in June 2019 but while re-testing this resistance as support the price action failed to retain its position above this level. After bullish move that has been started after the mid of March 2020. Finally the price action has again reached at this resistance level and if this $13 resistance will be broken out then we will have the next level resistance at $20 that is a key level resistance for NEO. Once this key level resistance will be broken out then it will be easy for the price line to reach up to the previous highest price ever in the history that is around $200 as on the long term the priceline of Neo has no significant resistance between $20 up to 200 dollars.
Conclusion:
At this time it is important for the priceline of NEO to cross up $13 level. As at the same time $13 is the resistance of an up channel and the wedge and ichimoku cloud as well. Once this resistance will be broken out then price action can reach next key level resistance at $20 within no time. And once the $20 will be broken out then on long-term it can reach upto $2 level very soon.
Note: This idea is education purpose only and not intended to be investment advice, please seek a duly licensed professional and do you own research before any investment.

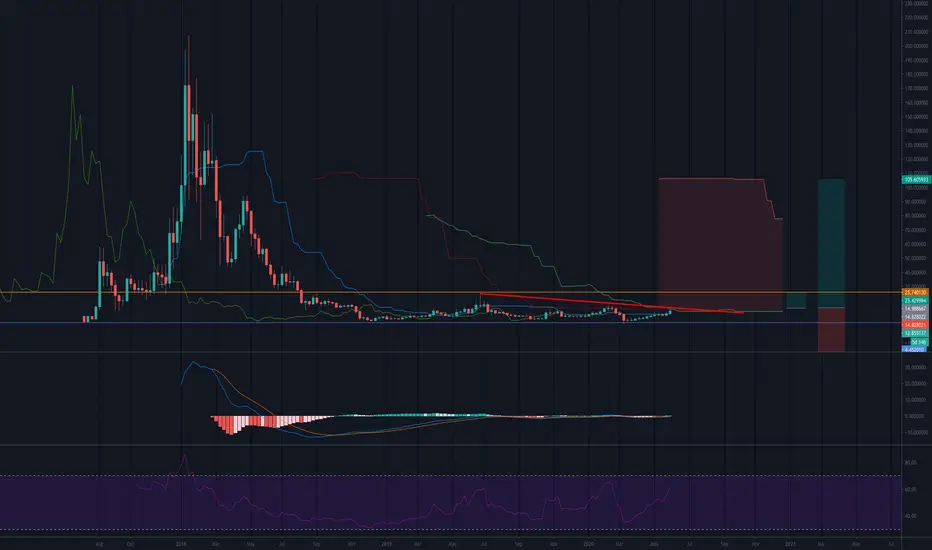
NEO Coin Formed Very Big Shark Pattern And Ready For Big MoveBig wedge:
On weekly chart priceline of Neo coin has formed a wedge and the support of this wedge is at 5.46 dollar. This is really very strong support that is not broken since December 2018. During the recent strong bearish move in the month of March 2020 we have seen that the price action has hit the spike upto $4 but could not break down the support. After placing the volume profile on the complete price action of this wedge as a result we can see that the traders interest is really very low below $6.8 and above $11.70. And the pint of control of volume profile is at $9.30. Therefore when the priceline moved in the area where the traders interest was weak it turned bullish and moved back into the zone where the traders are interested to trade.
Oscillators and indicators:
After hitting the support of this wedge the stochastic oscillator has given bull cross from the oversold zone and the moving average convergence divergence the MACD indicator was strong bearish but now it is turning bullish and if we see the directional movement then it can be exmaniced that the directional indicator 1+ is moving up to form a bull cross with the directional indicator 1- . Once this bull cross will be formed then the price action can turn more bullish to make an attempt to breakout the resistance of this wedge.
Ichimoku cloud:
If we see the ichimoku cloud on weekly chart then it can be observed that the bearish cloud is turned very weak at this time. Therefore it will be easy for the priceline to cross up the cloud. And once the pric line of Neo coin will be able to cross of the bearish cloud then it will be really a very big success for the Neo coin because the Neo coin could not cross up the bearish cloud on weekly chart since it is appeared in the history of this asset. The lagging span has entered in the priceline and once it will cross up the candlesticks then it will be another very strong bullish signal. The conversion line has touched the baseline and soon it will also form a complete bull cross then there will be strong chancess that the cloud will be turned bullish and the price action will cross up the ichimoku cloud. And after crossing up the cloud Neo coin can start a really very powerful bullish rally.
Very big bullish Shark pattern:
Now if we switch to the 2 week chart then it can be easily witness that the price range of NEO coin has completed a bullish shark harmonic patter. And after the completion of this pattern now the price range is moving in the potential reversal zone of this big bullish harmonic pattern. Potential reversal zone is also a buying area and the maximum extent of this potential reversal zone should be used as a stop loss. Now there are strong expectations that as per Fibonacci sequence of the priceline should move up from this area and enter in the Fibonacci projection of C to D leg from 0.382 to 0.786 Fibonacci projection.
The buying and sell zones start and end as below:
Buy between: $7.49 to $5.84
Sell between: $9.73 to $13.81
But if the price line will breakout the $13.81 barrier then it can turn really very strong bullish coz in that case it will also breakout the wedge resistance.
Final thoughts:
At this time all signals are turning bullish but soon they will be turned strong bullish because the Neo coin is already getting bounced from the support of wedge. But we should be careful about the stop loss and the support of the wedge or the potential reversal zone of Shark pattern should be used for this purpose.

Neutral on NEO, until... hi @shayyaaneshan, here's the NEO analysis that you requested.
NEOUSD has been stuck in a range for 2 years. From $5 to $25. Good news is that current price is testing the downwards trendline and also pushing against the weekly ichimoku cloud (using crypto settings). A rise from current price of about $13 to a closing weekly price of about $15 (or higher) suggests a test of the trading range ($25) and possible continuation all the way up the cloud to $100, a 600% gain.
The rise from $15 to $25 seems totally reasonable based on the technicals. We'd have to re-evaluate the chart once it reaches there to assess the breakout to that higher target of $100.
MACD and RSI both point up.
But until price closes inside the cloud above the downtrend resistance, it could just as easily get pushed down again from current price by bouncing off the bottom of the cloud and getting rejected once again by that downtrend.
Until NEOUSD breaks above downtrend resistance and cloud, we're Neutral.

$NEOUSD | Time for next big wave? $NEOUSD | Time for next big wave?
Hello friends,
After a few hectic weeks due to the coronavirus, I am back with some analyzes.
First of all i will say that performance out of the past not gives any garranty for the future.
Currently we see some upside movement on $BTC. Also some altcoins are already exploding a little bit like ZILLIQA.
We are currently in Bitcoin's halving and will start moving slowly upwards from now on. Still, I think the ALTS can give the first blow if levels are broken.
This NEO prediction is long term. And I just want to emphasize that I don't think $ 700 NEO is possible this year. I put the pattern here purely because it is POSSIBLE. But that we will get a new ATH someday I am convinced with this great project. Maybe we will be surprised again what we will get for gains this year.
I definitely see a $ 1000 NEO in 2021/2022 so let's keep a close eye on it.
Good luck!
FOLLOW & LIKE. (Leave your long term charts!)

neousdbought some, weekly ema55 is getting horizontal and previous weeks always touched to that line
this time possible to eliminate it


Neo Bullish Neo seems to be bullish.
- MA9 and MA200 crossed
- ascending triangle
- price targets: 11/12 & 16ish


NEO open entry doorCryptocurrency neo opened its door for buy. Momentum is good, and also break out was clean.
If daily close will stay strong in shape of bullish candle then, it will continue stronger.
Elitefxacademy wish you best trading!

NEOUSD weekly 90% gains BUY NOW(NEW)before we kick start the update. your upvotes/subs
are appreciated.
Why get subbed to to me on Tradingview?
-TOP author on TradingView
-professional chart break downs
-key levels
-no junk on my charts
-frequent updates
-covering FX/crypto/US stocks
-24/7 uptime so constant updates
So without further due. Keep it short/simple and to the
point.
NEOUSD weekly 90% gains BUY NOW(NEW)
IMPORTANT NOTE: this is speculative setup.
results not guaranteed. do your own due dill.
at all times please use a stop loss.
NEOUSD weekly (Finex), XABCD setup, 90% gains
from current price. Recommended strategy:
market BUY now TP is +50% gains.
good luck traders.
get subbed to stay tuned for all the latest updates.
also add likes to support my efforts, thank you.

NEOUSDA quick short on the 4hr down to the 0.618 fib or prior structure / fractal. Looks to be forming an evening star pattern. Not advice.
NEOUSD is about to run - around 30% profits in few daysMany indicators are showing an imminent bullish movement. Stochastic is about to reverse, Parallel channel will not resist the upcoming movement and the weekly indicators are all bullish.
You can see our target in the graphics. Be carefull and protect yourself with stoploss.
------------------------------------------------------
Good Luck
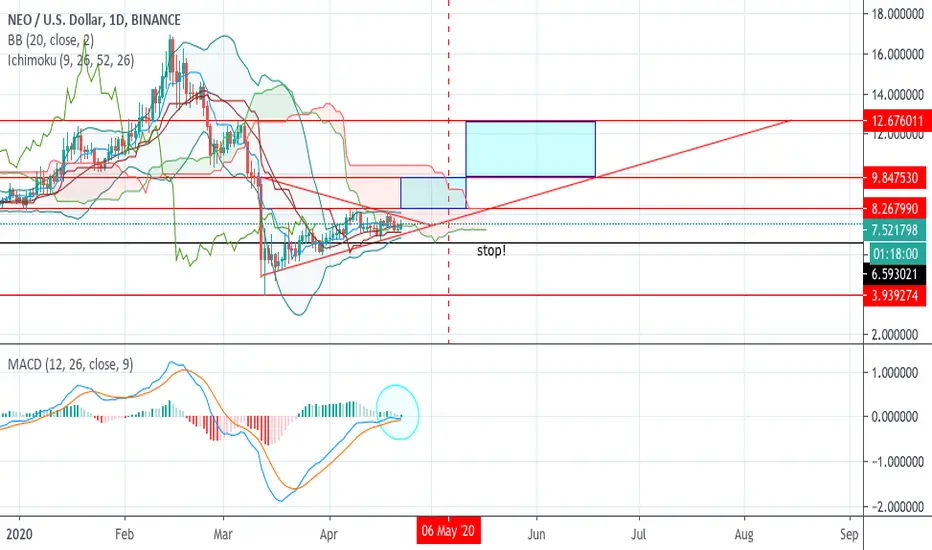
NEOUSDPossible short. Price is below the kumo (cloud) and the chikou spanis (orange line) is below kumo - once price closes below the kijun sen (light pink line)and the kenkan sen (pale blue line) and RSI has turned red and is moving below middle blue line, open a short. Use support lines to take profit and look for change of trend momentum. Not advice.

NEO broke out from bullish pennant. Now time for a retest!Oh NEO how did I miss you. I tried to short you in the middle of the rally and that did not work out well. The trend is clearly up and looks like alts are ready to run. NEO already made considerable gains and now it looks like it is coming back to test this pennant and that would be good time to reload.

NEO movement within WedgeMovement within wedge can be seen to respect Fibonacci spirals, will this movement continue with a third up-wave? or will this result in a breakout?
This wedge formed is a falling wedge technically however it is quite horizontal


Fibonacci wavesTesting to see if 1.618 follows a bullish trend that was previously seen within the ring of the Fibonacci circle, hence creating the wave.
Here is my original analysis for Fib Waves which is still underway
I believe we will see a repeat bullish momentum throughout the fib ring.
Not much of an analysis for NEO but here we are.
