NEOUSD trade ideas

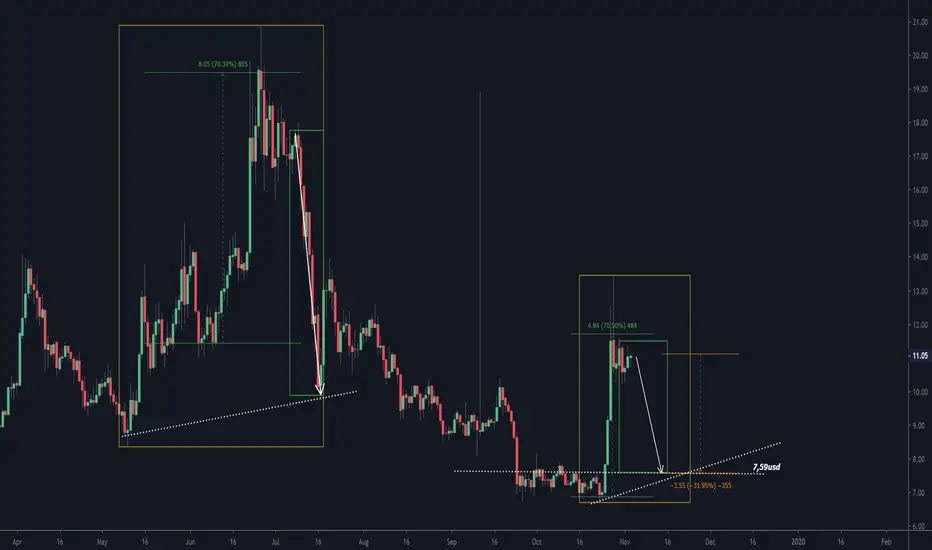
NEOUSD before the 32% decline.... The similarity of the fractal sequences in the analysis is given by the same percentage of the initial rise. Although I have written about this many times, I repeat that comparing the percentage is because the vertical scale is logarithmic. So the rule is to measure the percentage of displacements. For linear scale division, vertical measurement is done with points. But back to the analysis. My assumption is that a similar fractal structure can be formed as the first fractal. Therefore, the exchange rate target price is US $ 7.59.
NEO/USDT (1D) Pump! Whats next?Overall we are moving in an ascending channel. But we just hit the middle of the channel, and now we can be flatting around this middle of the channel for a long time. I wouldn't expect big movements now. Trading between levels will be a safe bet.

Neo flagBreakout, long position.
Price will breakout from the triangle (flat bottom triangle), should break out to the up side.
Buy.

Neo LongShould bounce off support.
Best Buy point is 11.57
Could go up to around $14 after buy point, take profit anywhere from about 13 up to 14.5.

NEO- Pump and Dump!NEO outperformed a lot from when President Xi's announcement has been published!
What to expect from the chart technically?
- Tested Major Resistance line and sitting at correction stage.
- I believe we are in A stage of A/B/C correction.
- Where's support? Probably the white dot line we will test as a support.
Be prepared for Q4 of 2019.
Hope you guys make good money and have a plan for trading always!
Thanks for your likes and comments.

There is a possibility for the beginning of an uptrend in NEOUSDTechnical analysis:
. Neo/Dollar is in a range bound and the beginning of uptrend is expected.
.The price is above the 21-Day WEMA which acts as a dynamic support.
. The RSI is at 68.
Trading suggestion:
. There is a possibility of temporary retracement to suggested support zone (8.50000000 to 6.50000000). if so, traders can set orders based on Price Action and expect to reach short-term targets.
Beginning of entry zone (8.50000000)
Ending of entry zone (6.50000000)
Entry signal:
Signal to enter the market occurs when the price comes to " Buy zone " then forms one of the reversal patterns, whether " Bullish Engulfing ", " Hammer " or " Valley " in other words, NO entry signal when the price comes to the zone BUT after any of reversal patterns is formed in the zone. To learn more about " Entry signal " and the special version of our " Price Action " strategy FOLLOW our lessons :
Take Profits:
TP1= @ 10.80000000
TP2= @ 14.27000000
TP3= @ 17.65000000
TP4= @ 20.75000000
TP5= @ 24.99500000
TP6= @ 31.86500000
TP7= @ 43.90000000
TP8= @ 68.98000000
TP9= @ 93.13500000
TP10= Free

(NFA/DYOR) NEOUSD: THREE instances of bullish divergence?Instinct would tell me that NEOUSD is a bit overextended and that we should expect a small pullback... but then I saw this. What do you guys think?
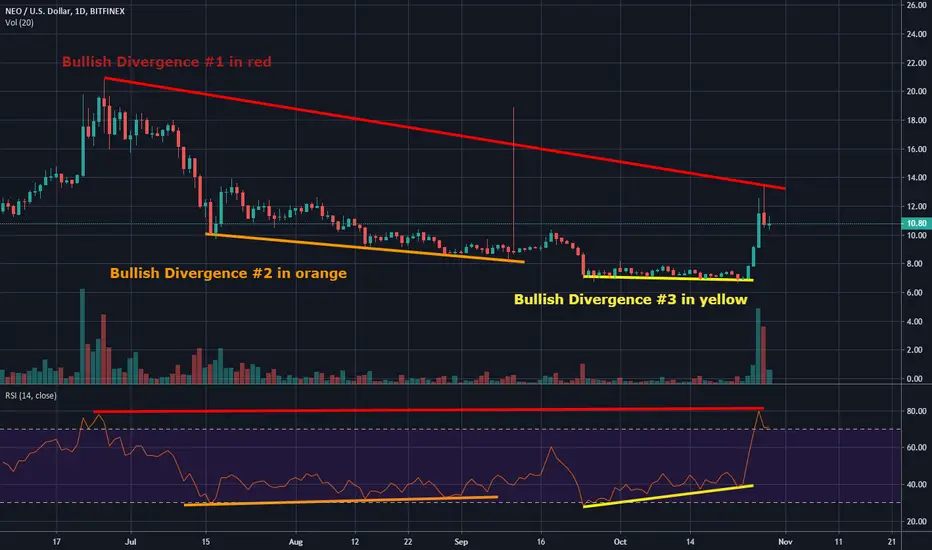
NEO Can Target $32-45 If It Breaks This ResistanceWell well well...look who's made a comeback? NEO has been one of my favorite cryptocurrencies since I first started learning about this insane market. I almost FOMO'd into it when it was above $130, but I held off. A year ago, I made a post about why I expected single digit NEO if the $13-16 area broke down (linked at bottom). That played out beautifully, and I was able to scoop up some in the single digits. I also posted an analysis suggesting that NEO had found bottom just below $6. NEO actually then had an impressive run, all the way up to the $20 area, where it peaked in June, ultimately breaking down from the ascending broadening pattern (red).
What's especially interesting is that NEO is currently finding resistance in a VERY obvious location. Why so obvious? Just look at the ridiculous intersection of important trends. We have the red broken channel support from earlier this year. We have a major multi-year pivot area in the $13 zone, and then we also have the descending resistance from the all-time high (orange) AND the 200d MA (around $10.95 currently).
I don't think I've ever seen a confluence of resistances like this. Often when trends align like this, it can produce a powerful move. Look what happened with Bitcoin this past week. Its moving averages were all moving closer and closer together, indicating that the market is finding a "fair price" and that a long term direction will need to be picked soon.
Unfortunately, I assumed NEO could test the $30 area earlier this year, but instead most altcoins have ventured down to test zones closer to their bear market lows. Most have held these levels (like NEO), while others have not (like XLM and GVT). Right now, I'm not saying NEO will DEFINITELY get up to $32-45 on a major breakout. It will need to tackle this major confluence of resistances first. The longer this takes to play out, I think the harder it will be. The market can of course take its time. This doesn't have to happen immediately, or at all. But if NEO does break out and make it to my initial targets, it should tell us that alts have indeed been in a second bottom accumulation phase, much like Bitcoin's 2015 bear market. A mark up for NEO to the $32-45 zone would be the first major higher high, and would signal that accumulation has ended for promising cryptocurrencies.
Why do I list $32-45 as my target zone? This is where the 100 week Moving Average is, and $45 is also a very important area for NEO, as you can see on my chart. I think if we see a bit of a blow-off for NEO's initial impulse up, it is likely to get stopped in that price range. I will actually look to finally take some profit from my $6 entry and perhaps set up for a larger swing trade. Further targets are also listed on this chart. I left some room here as well, in case it's about to begin an even larger move up to target $1000+ prices.
This is not financial advice. This analysis is purely my opinion based on what I'm seeing and my own sentiment. I just wanted to post an update on NEO since it's been a while, and it's finally showing some life. It has some serious obstacles to overcome though. If it can't overcome the bear market downtrend, it may just be in an enormous wedge, and it can head to new lows if the market cannot get going within the next several months.
-Victor Cobra

NEO - Continuation higher expected.Trade Idea - We look to Buy at 9.9650
Broken out of the wedge formation to the upside.
The continuation higher in prices through resistance has been impressive with strong momentum and shows no signs of slowing.
After strong buying pressure at the start of the week the pair consolidated yesterday with little net change and all price action within the upper half of the previous day’s range.
Bespoke support is located at 9.965.
Expect trading to remain mixed and volatile.
Stop: 9.050
Target 1: 16.50
Trget 2: 17.00
Join us in our new Crypto Telegram channel - t.me


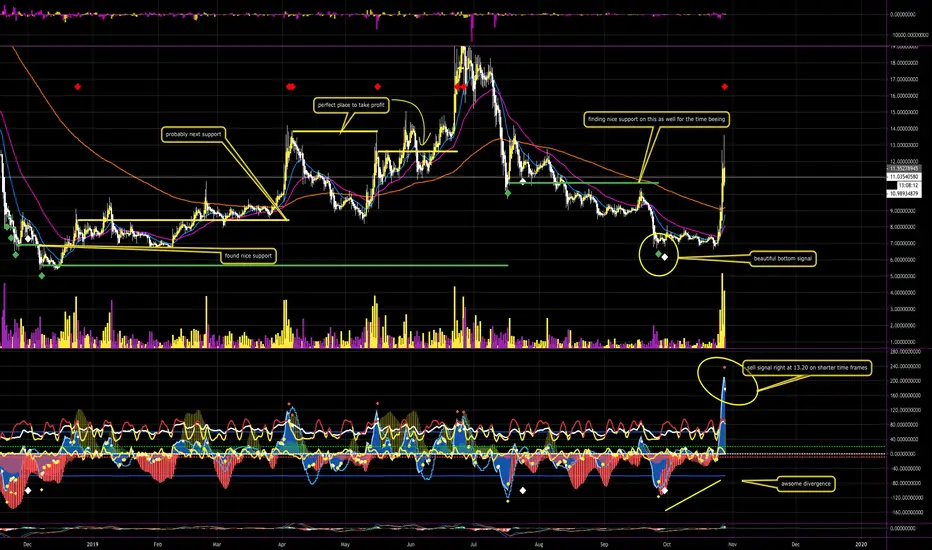
NEO, lots to look at this indicator rocks. tells you a beautiful story on price action, target for the retrace on chart
NEO NOW IS VERY NICE FOR HOLDhii
neo if break downtrend and close one daily candle on it can reached targets in midterm


NED SHORT in Shortterm TradeHello to all watching my charts.
NEO has nearly double but now
in a pullback phase has fallen below major support level at
11.23 and is now in short mode ONLY in SHORTTIME VIEW
Now we can have an eye on the rendline whether it breaks
also for a bigger pullback or whether it holds to have
a only shorttime pullback.
In longer view we are in LONG mode.
but in the shortime VIEW of NEO in the 1 HR chart
it looks SHORT.
Good trades
If you want to support my work , please be so kind and like them
-
My posts are not and advice to buy or sell something
always do your own research
-
Renkotrade

NEO: 100% profit per week !Hello, Traders!
Monfex is at your service and today we overview NEO/USD .
There is a big bearish divergence that can pull the price to the red horizontal support line.
But there are also two bullish divergences, which are stronger with this trend movement.
Watch our previous signals by NEO/USD and NEO/BTC below!
The support zone ~ $10.36
Active Trade Signal by NEO/USD
Buy near $11.20
Take profit ~ $14.70
Stop loss at $10.23
Market Cap
$826 094 818 USD
Volume (24h)
$1 327 328 684 USD
Circulating Supply
70 538 831 NEO
Share your thoughts, ideas about the market under the chart.
GOOD LUCK AND LOTS OF PROFITS !!
Disclaimer
This report is for information purposes only and should not be considered a solicitation to buy or sell any trading assets. Monfex accepts no responsibility for any consequences resulting from the use of this material. Any person acting on this trade idea does so entirely at their own risk.

NEO's close to Loss of value Or not, take a look at this chart!Hi, dear Traders!
Monfex is at your service and today we overview NEO/USD .
We obviously see the triangle formation which locally is in the bearish trend. Breakout of the triangle's support or resistance lines will be first sign for some actions( buy or sell) , but for a more confidence we need to act by breakout the key levels.
The great volumes that are also like a support level for a price with the support line of the triangle can be a salvation from the fall.
Share your thoughts, ideas about the market under the chart.
Stay with me and you will get in time signals for NEO/USD
GOOD LUCK AND LOTS OF PROFITS !!
Disclaimer
This report is for information purposes only and should not be considered a solicitation to buy or sell any trading assets. Monfex accepts no responsibility for any consequences resulting from the use of this material. Any person acting on this trade idea does so entirely at their own risk.

NEO is going to test $7 !Hello, Traders!
Monfex is at your service and today we overview NEO/USD .
NEO broke the triangle and has already tested the ex-support of this triangle and it's near the resistance zone and MA200. There is a downward movement globally, the bears control a situation. Stoch RSI has a bearish div and going down to oversold zone.
The local support ~ $ 7.30
The great support zone ~ $ 7 - 6.85
NEO has two scenarios:
breakout the support zone with target below $ 6 -
breakout the resistance zone with target more then $ 8 +
Market Cap
$522 507 926 USD
Volume (24h)
$230 924 554 USD
Circulating Supply
70 538 831 NEO
Share your thoughts, ideas about the market under the chart.
Watch for our Updates to be the first who gets well-timed signals !
GOOD LUCK AND LOTS OF PROFITS !!
Disclaimer
This report is for information purposes only and should not be considered a solicitation to buy or sell any trading assets. Monfex accepts no responsibility for any consequences resulting from the use of this material. Any person acting on this trade idea does so entirely at their own risk.

neo just startingWe show the hesitation here at the stratosphere, and proceed to bag bodies on the moon ;)
Thank me later

Neo - short or long ?Convergence at RSI, AO
accordingly, the reaction from the level with good growth)
Thank you. Neo for making money.
Now I see another shopping opportunity.
Shopping from Fibonacci
Level 0.5 - 0.61 - 0.38
STOP loss - level 0
If you want to receive high-quality signals, write to my admin in a telegram @tradingroommmm


