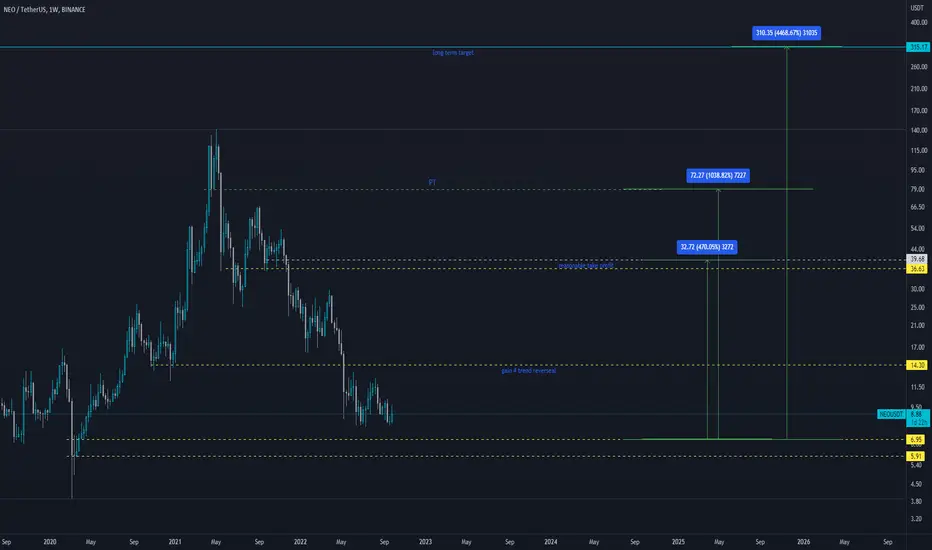
NEO strong support lineNeo is now at a strong support line from which i expect a rebound to the following price targets:
NEO/USDT
Entry Range: $8.40 - 8.70
Price Target 1: $10.30
Price Target 2: $12.65
Price Target 3: $17.70
Stop Loss: $7.40
NEOUSDT trade ideas

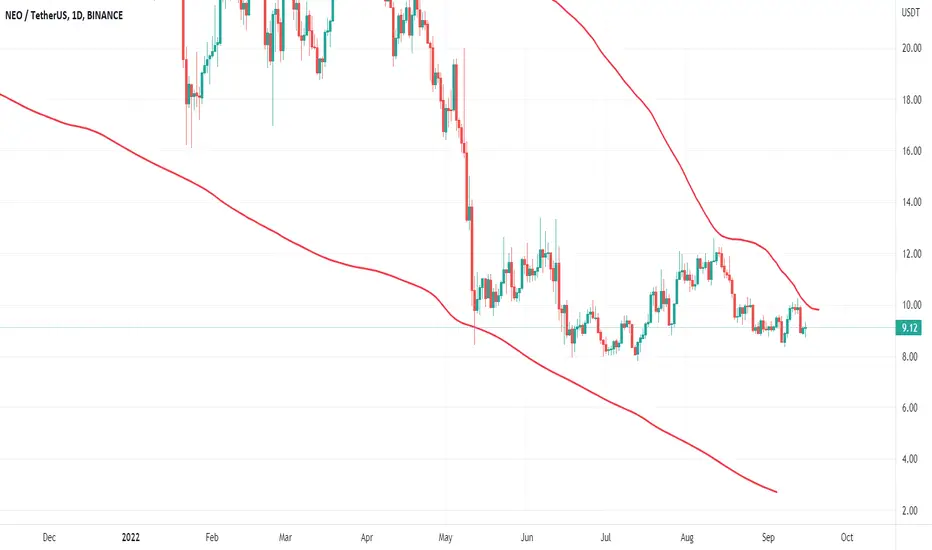
Homework, MA50+MA200 trend on NEOUSDT 12hUP
AZT
DOWN
Trend detection
Homework 2022
Homework 2022
In TRADIUM we trade
In TRADIUM we trade
In TRADIUM we trade
In TRADIUM we trade

Homework Divs+volume+candle patterns 2h NEO\USDTHomework 2022
Homework 2022
Homework 2022
Homework 2022
Homework 2022
Homework 2022

4h head and shoulders for NEOAlso when we can focus the 4h chart there is a head and shoulders, lets see if it will be work.

NEO READY FOR SHORT For 1 day chart there is a reverse flag. RSI is on top. BINANCE:NEOUSDTPERP Try short here.

NEO is the true matrix frfrdont wanna miss this ride twice huh, on the low end just at a general trend retrace youre still talking insane percentage gains here let alone the longer term play
Neo can keep pumpingI think we are in a diametric structure where we can still move higher. I myself will wait, if the candles reach the red zone, I will open a short position

NEO: TREND CHARTNEO known as one of the history best coins.
Since BTC did increase on low time frame NEO seems to make new gains on low level, we will see or this trend will get confirmed on long term.

NEOUSDT - H4 - Bullish ButterflyPattern is near completion at a key dayly support near 7.86
We could expect a bounce at that area.
Best regards.

NEOUSDT#NEOUSDT
(LONG SIGNAL)
(SWING TRADE)
MACD is showing bullish
EMAs showing a bullish move
RSI is neutral
in daily chart time we have falling wedge pattern and as you can see the powerful of this support so i expect this is the time to trade in swing tradee at this coin
targets set at the chart

NEOUSDT#NEOUSDT
(LONG SIGNAL)
(SWING TRADE)
in daily chart time we have falling wedge pattern and as you can see the powerful of this support so i expect this is the time to trade in swing tradee at this coin
MACD is showing bullish
EMAs showing a bullish move
RSI is neutral
targets set at the chart

NEO | When to buy? 🤷♀️Hello Traders. I hope you are having a great weekend.
Today I am looking at NEO`s chart on daily timeframe and as you can see there is a descending line ahead of the price which should be
broken if the price wants to go higher. Best time to buy is when it breaks it with good volume then pullbacks to the yellow area with the target shown.
SL could be around 18$.
🚩 Always remember to put stop loss for your orders in order to reduce the risk of your trades.
🚩 Always keep an eye on BTC chart as well because it can affect the movement of altcoins as you all know my dear traders.
Thank you guys for reading my idea on NEO and don`t forget to comment what you think. ✌

Neo Must Break Through HereNEO Trading at resistance. Big test this week, grab your seat we are ready for takeoff.
NEO struggling to close a daily candle above the $10I will be going limit short from 9.977 as link is struggling to maintain above the $10

NEO Price tightening, patience is key, next week will be something else. Big resistance ahead of most coins

NEOUSDT | RISISNG WEDGENEOUSDT has been trading in a rising wedge . The price has approached to lower boundary of wedge .
The bulls need to hold the support zone and must break above the horizontal resistance. While bears will be active below break of wedge.
Trade your levels accordingly.

Neousdt Long trade short termOn 4 hour time frame neo formed cup and handle pattern which is bullish continuation pattern. enter at breakout
Target is mentioned

NEO Analysis"You know that NEO is being considered as the next Ethereum because of the advantages it offers over Ethereum in terms of technology."

NEO Potential Short / LongThe above chart is based on symbol NEOUSDT - Binance.
Alerts have been set.
The trading plan is to ladder in 0.25% below Entry, on Entry and 0.25% above entry.
Stoploss(SL) is at 1.5%.
Risk Management is always important. Let the trade come to you.
Take Profits(TP) at 1% increments.
First TP1 will have a higher percentage of take profit.
If/when TP1 is hit, SL will be move to entry.
Do Techincal Analysis(TA) stick to your plan, let the trade come to you, and don't FOMO, if your plan does not come to fruition (not hit) then you have not lost any money, have a SL to ensure best practice so you can continue trading, journal your trade for self development and reflection.

NEO vs USDT --- LONG--- 26.08.22Looks like this structure is just being copied from the book of wave analysis

NEOUSDTHello Dear friends
The price range of $10.6 has nicely maintained the trend. If the upward channel is maintained and the trend does not fall below the price range of $10.23, the possibility of forming an upward trend up to the price range of $12.1 is not out of mind.
Currently, a bearish wedge has formed in the 30-minute time frame. If the upward trend is above the price range of $11.19, the mentality of forming an upward trend up to the specified range will be strengthened for us.
We would be happy to hear your comments.

NEO/USDTNEO/USDT
It is in a descending channel.
It is above the $9.5 support.
We have the possibility of increasing the price up to the ceiling of the channel and the range of 12 dollars.
#NEOUSDT #NEO #BTCUSDT #BTC #ETHUSDT #DOGE #DOGEUSDT

Neo short Neo is looking High Risk high reward setup for short if it breaks first two blue lines it will hit last one soon
