NEO/USDT - Long - Potential 200.26%NEO/USDT - Long Term Long - Potential 200.26%
Exchanges: Binance, KuCoin, Bittrex, Huobi.pro
Signal Type: Regular (Long)
Entry Zone:
8.62 - 9.15
Take-Profit Targets:
1) 13.28 - 33.333%
2) 22.82 - 33.333%
3) 27.32 - 33.333%
Stop Targets:
1) 4.61 - 100.0%
Entry Trigger - Breakout on daily RSI, could see price pullback to support in entry zone before following. Binance supported network upgrade June 19th & high development on network.
Trailing Configuration:
Entry: Percentage (0.0%)
Stop: Breakeven -
Trigger: Target (1)
NEOUSDT trade ideas

we shall expect Big Movements from NEO pretty soon!NEO is in a Broadening wedge Pattern and This Means the Odds of Break out is pretty Low but there is still a Chance! Right now the Price is near the To of the Pattern which means The Price shall reach the Top soon and we shall expect two movements From there. one is that the The Price would Still Be in the Pattern and That It would Start a Bearish Movement From There. another thing which has a Low chance of occurrence is that the Price would Do a Break out and start a Bullish Movement which would Increase the Price to 11.5$ otherwise Price will reach 7.650$. which one is gonna occur? We shall get our answer In a few Days! This chart and Info are Provided by our Sponsor WHITEBIT Exchange. Please Check their Exchange Using the link down below.
-NEO is in a broadening wedge Pattern.
-Price is near the Top of the Pattern.
-When It reaches the Top of the Pattern, we shall Expect two Movements.
-The Price shall fall to 7.650$ or a break out Happens and Price will reach 11.5$.
_ _ _ _ _ _ _ _ _ _ _ _ _ _ _ _ _ _ _ _ _ _ _ _ _ _ _ _ _ _ _ _ _
Thank you for seeing idea .
Have a nice day and Good luck

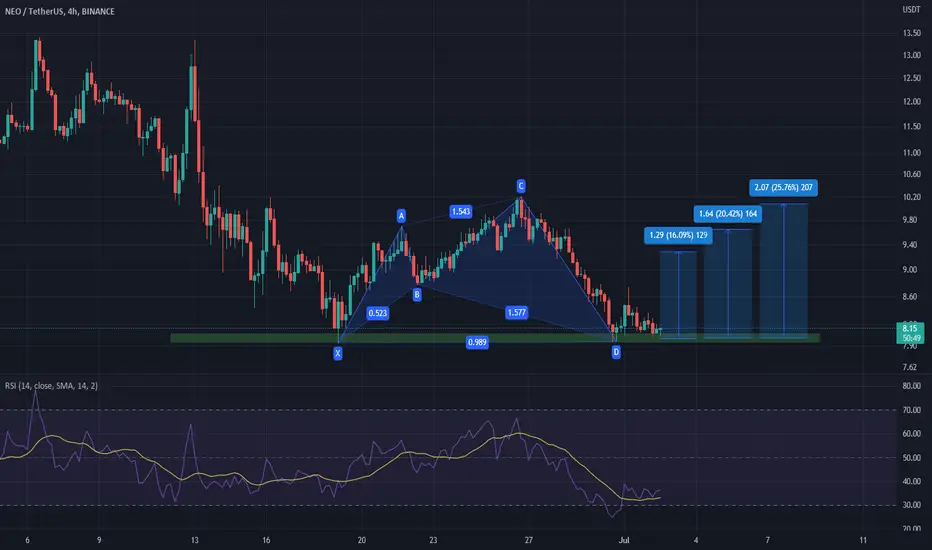
NEO/USDT-12H-BINANCE(Bullish Shark)This is not a financial advice. Always do your own research and always put stoploss in your trade (SL) :) If you want more detailed info
how to study and read charts or just need help with some coin, just write to me here a comment, i will try to answer to everybody...
i can help you :) all for free, don't worry, BE HAPPY!
NEOUSDTWe can buy between 10 to 8.45
The real-up movement will start by breaking out at 10.30
Zone to take profits between 12 - 16

NEO coin formed bullish Butterfly for upto 869% moveHi dear friends, hope you are well and welcome to the new trade setup of NEO coin.
On a weekly time frame, NEO has formed a bullish butterfly pattern
Note: Above idea is for educational purpose only. It is advised to diversify and strictly follow the stop loss, and don't get stuck with trade.

NEOUSDTBased on this intensive movement that we have in the four-hour chart and the reaction that the price has shown to the blue range.
I have the mentality that the price should come out of the compression from the bottom.
The $ 12.698 price range seems to be suitable for the reaction and the entry point for the trade.

NEO 15mHello Trades,
Seems like NEO reached the top of the channel and the bottom of the bearflag again to retest it
You can trade this .
Target if it didn't break to the upside
should be the bottom of the channel.
On the chart we got the following :
Bearish divergence on 5m and 15m .
over bought on some indicators at 5m 15m 30m chart
we are on a strong resistance.
-
Have a nice day


NEO Entry Range, Take Profits and Stop LossNEO/USDT
Entry Range: $11.00 - 12.69
Price Target 1: $15.87
Price Target 2: $18.76
Price Target 3: $24.22
Stop Loss: $9.30

NEO trade ideaOverextended and rejecting from channel top and bottom of previous bearish block formed on the hourly chart, NEO is on the way to offer a new entry opportunity.
If we get scenario A (reject on 0.5F) we will not enter any longs because of the low RR
If we get scenario B(break through 0.5F) we will activate a DCA trade that has two open orders between 0.5 and 0.618 and a lower one near the last bullish block.

NeousdtNeo looks good for nice pullback remember everything depends on btc to me the entire market will recover a little bit in the coming days


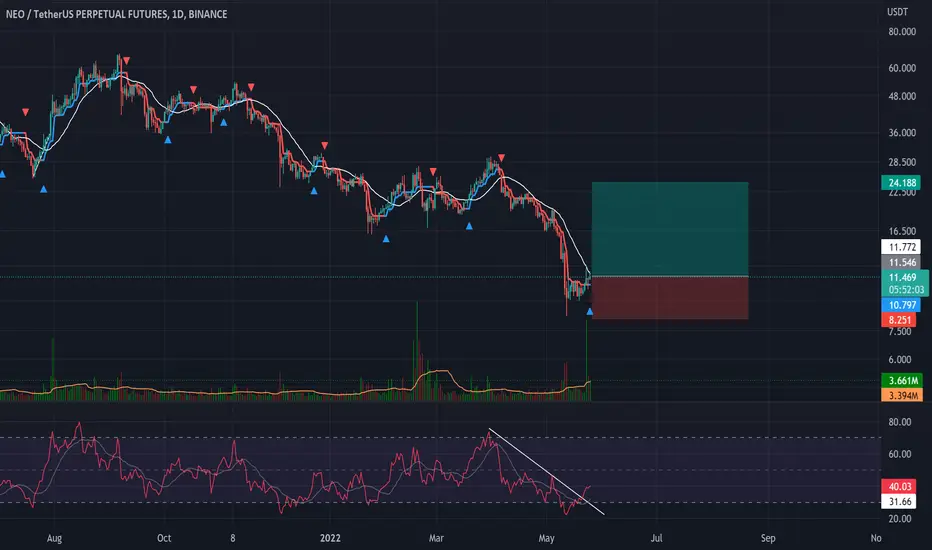
🔥 NEO Has Entered Long-Term Accumulation PhaseBack in January I made an analysis on NEO where I argued that NEO was likely going to see more bearish pressure, which would bring it all the way back to 2019 price levels. Consequently, this could be considered as a long-term accumulation phase in preparation for the next bull-cycle. The yellow line is a copy from the previous accumulation phase and bull-cycle and is there just for visual purposes.
Be aware that NEO's bottom is most likely not in yet. With Bitcoin Dominance rising, it's very plausible that NEO can fall another 50%-80% over the coming months.
However, if you're looking to dollar-cost-average NEO, this is the time to do so.

NEOUSDTThere are two possibilities for NEOUSDT.
It seems that Neo is now in a triangular pattern.
If this pattern is broken from above, about 250% profit can be expected for the long position.
And if it breaks from the bottom, we will have about 50% of the expected profit for the short position.

can neo back to the chanel?! hi friends new had a very good voloume and now we have to see it can back and break the dynamic resistanse
if it can to break the dynamik resistanse , so its can to go uper .

NEO | Bullish Wave Should Begin During The Coming WeekesNEO | Bullish Wave Should Begin During The Coming Weekes
After the strong drop on BTC and all the other altcoins we can see that the price
is taking a pause in many of them.
On the NEO chart we can see that the price completed a Harmonic Pattern in
a very strong and old support area as well.
This bullish support can push the price up again in the coming weeks or months as long
as the price already stopped the bearish movement.
Thank you and Good Luck!

NEO - OUT OF RANGESmall daily view for NEO
NEO - OUT OF RANGE
we will follow up to see how it will go out.

💡Don't miss the great buy opportunity in NEOUSD @Neo_BlockchainTrading suggestion:
". There is a possibility of temporary retracement to the suggested support line (11.18).
. if so, traders can set orders based on Price Action and expect to reach short-term targets."
Technical analysis:
. NEOUSDT is in a range bound, and the beginning of an uptrend is expected.
. The price is below the 21-Day WEMA, which acts as a dynamic resistance.
. The RSI is at 64.
Take Profits:
TP1= @ 12.22
TP2= @ 12.64
TP3= @ 13.28
TP4= @ 14.11
TP5= @ 15.00
SL= Break below S2
❤️ If you find this helpful and want more FREE forecasts in TradingView
. . . . . Please show your support back,
. . . . . . . . Hit the 👍 LIKE button,
. . . . . . . . . . Drop some feedback below in the comment!
❤️ Your support is very much 🙏 appreciated!❤️
💎 Want us to help you become a better Forex / Crypto trader?
Now, It's your turn!
Be sure to leave a comment; let us know how you see this opportunity and forecast.
Trade well, ❤️
ForecastCity English Support Team ❤️

💡Don't miss the great buy opportunity in NEOUSD @Neo_BlockchainTrading suggestion:
". There is a possibility of temporary retracement to the suggested support line (11.18).
. if so, traders can set orders based on Price Action and expect to reach short-term targets."
Technical analysis:
. NEOUSD is in a range bound, and the beginning of an uptrend is expected.
. The price is below the 21-Day WEMA, which acts as a dynamic resistance.
. The RSI is at 63.
Take Profits:
TP1= @ 12.22
TP2= @ 12.64
TP3= @ 13.28
TP4= @ 14.11
TP5= @ 15.00
SL= Break below S2
❤️ If you find this helpful and want more FREE forecasts in TradingView
. . . . . Please show your support back,
. . . . . . . . Hit the 👍 LIKE button,
. . . . . . . . . . Drop some feedback below in the comment!
❤️ Your support is very much 🙏 appreciated! ❤️
💎 Want us to help you become a better Forex / Crypto trader ?
Now, It's your turn !
Be sure to leave a comment; let us know how you see this opportunity and forecast.
Trade well, ❤️
ForecastCity English Support Team ❤️
