NEOUSDT trade ideas

NEOUSDT- 1HNEO on the 1 H chart with a possible reversal structure!
For every new follower i will add a new idea :)

NEO climbing higher; Potential move to $200!!Neo maintains strong uptrend, with an extremely clean wave count where clear waves can be see in each MACRO impulse wave to the upside; we can see the valid wave count Indicated on chart would suggest we have another push from this Subminuette wave 4 consolidation reflective of a triangle structure. Potential Subminuette 5th wave targets are the 2.618 fib extension of MICRO wave 1 sitting at $198; further to this we have a reasonable target at $166 the ~1.382 fib extension of Minor Wave 1.
Please like and follow for more updates; and regular market analysis.


NEO $94 Strong SupportThis should be a great opportunity to buy the dip on NEO. $94 should prove as strong support. Of course, this is crypto, so take it with a grain of salt. Peace.
👇👇👇👇Join the discussion👇👇👇👇


🔥 NEO Bullish Channel ReversalSince the major BTC sell-off of two weeks ago, NEO has been trading in a small upwards channel. Last night, when BTC fell a couple of percent, NEO fell with it. Luckily NEO found support near the support line of the channel and is currently reversing from said support.
Mid-term target would be the current ATH.
Happy trading!


NEO/USD : WHAT A BEAUTIFUL CHART neo/usd has to reach its ATH like LITECOIN AND MANY OTHE COINS ,so great upside potential can be seen , neo overall is a great all in one project to invest in { not a financial advice}...

Neo Usdt $1 d TF
bullish divegence in RSI , STOCHASTIC , MACD
Neo is strong Project and Bullish.
Abc pattern forming.
Good Luck :)

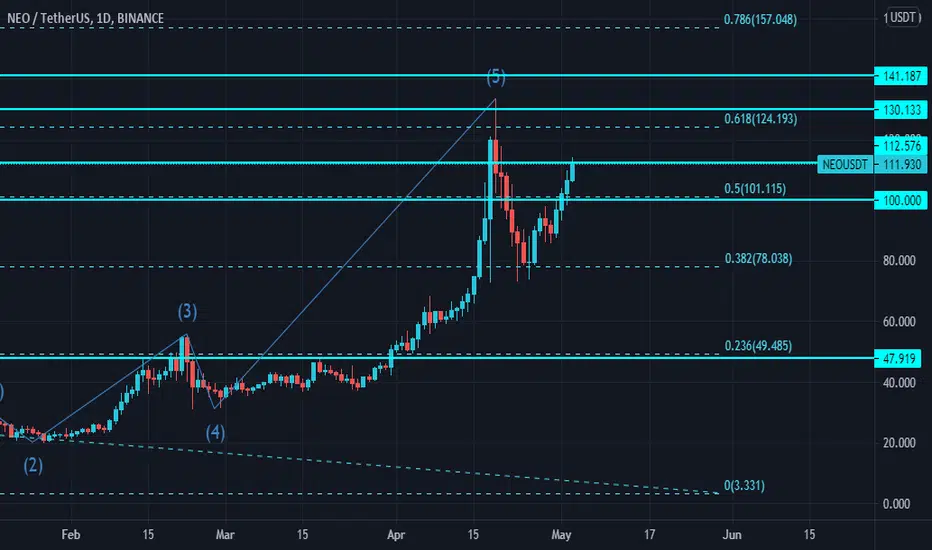
NEO next targetLike to support and follow for more content!
As you can see, NEO couldn't break above the Golden ration taken from the ATH . Now we expect it to reach 124 again and break above it, if it does, our targets are (mid term):
130
140
170
200
If you go on lower time frame, you can see that NEO is testing the 61.8% of the fib take from the high to the low (110 level), we need to break and close above to see a continuation on the short term.
What do you think?
Good luck traders,
NajjarTrading
NEO good buy from this levelprice break supply level and we can take good buy with TP 117.50$ SL 96.5$

NEO has Bullish Trading Setup LongtermHello,
NEO USDT has forming continuous bullish patterns, and not stopping here.
Currently bounced of the 0.5 Fibonnaci levels, and sitting over daily 20 moving average which is bullish sign technically.
the volume is quite good.
Fundamentals :
"RC2 testnet will be set up on May 18th."
To the moon :D
Cheers.

neousdthis is another banger for a futures position, still hasn't hit price discovery and you can take out a future position on kucoin. neo to slow dow right at 107.23 the from there it is going straight to 125-135 zone/ after that zone its going straight up to 170. this is a great play short term won't have to wait long for this one to pop.

Trading idea for NEOUSDTNeo may revisit its previous resistance levels once it completes its retest and gets its reaction after correction.


NEOUSDT Descending Triangle Bullish Breakout & RetestNEOUSDT Descending Triangle Bullish Breakout & Retest Completed.
The market also filled order block and pumping RN.
NOTE: DO YOUR OWN ANALYSIS. DO PROPER RISK AND MONEY MANAGEMENT. SPOT TRADING ONLY.
Buying Zone Above:
Above BZ1: 95.266
BZ2: 96
BZ3: 97
Targets:
TP1: 105.139
TP2: 118.027
TP3: 133.691
TP4: 170.374
Stop Loss: 75.302

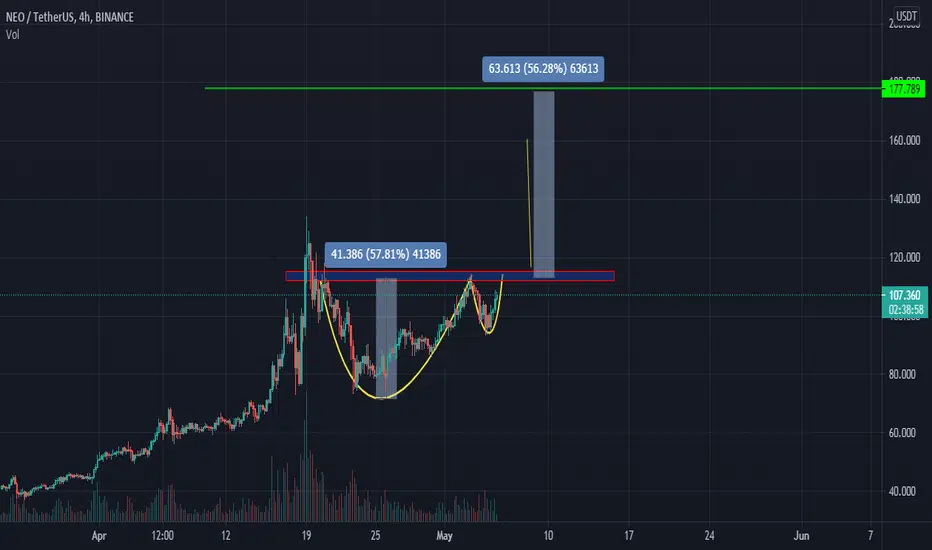
NEOUSDTHello to you all. Mars Signals team wishes you high profits at all times.
The price is a good support and it is starting to move upwards and over time it can touch its targets. We have also drawn a green support line for you.
Warning: This is just a suggestion to you and we do not guarantee profits.
Wish you luck!

NEO 4H BUYAlso set some Buy orders near the Trendline
Remember no more than 5% of the deposit in one trade
SL: next sell signal
