NEO/USDT bullish horizon from demand? 🚀NEO Analysis
💎 Paradisers, gear up for a promising trading journey with #NEOUSDT, as it unveils potential for a bullish surge from its demand zone.
💎 Delving into #NEO path, we've noted its rise following the closure of an FVG at a crucial supply level of $13.70. Despite a momentary slow-down, we're now eyeing a bullish jump from the demand level of $12.25, enhanced by significant liquidity, making a strong case for a turnaround. Staying resilient at this level may well lay the groundwork for the anticipated bullish journey.
💎 Should the drive for NASDAQ:NEO begin to diminish, we're set to look for a revitalizing leap from the solid demand level at $11.57. Yet, falling below this key level might herald the start of a deeper bearish phase.
NEOUSDT trade ideas


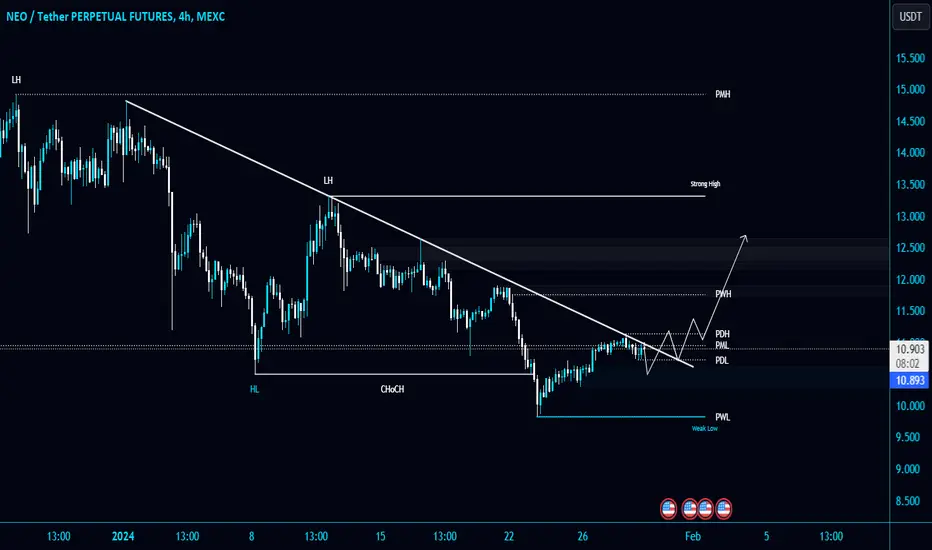
NEO will blow up SoonNeo will break up trendline
Neo will break up resistance
After breakout will be retest of trendline.
And after that to the Moon 🌙

$NEOUSDT Chart IdeaMy NEOUSDT chart idea, in my opinion, a breakout will pump NEO up to $19.518~ (May 2022 zone), will slow down and break out up to $35.77~ resistance area and will mark the top for NEO, and will continue downwards.
Entry for this trade is at the edge of the breakout, $13.657.

NEO - China's EthereumThe price, which has been moving in the accumulation zone for a long time, finally decided to target the upper zones.
Let's watch

NEO Long Scenario NEO long Scenario.
Breakout of trendline.
Breakout of MA.
Breakout of residence.
Will enter Long

#NEO/USDT is trying to break the Diagonal Trendline in 4-Hour TF#NEO/USDT is trying to break the Diagonal Trendline in 4-Hour TF!
NASDAQ:NEO needs to clear the PDH $11.15 resistance level to gain the bullish momentum. I am expecting #NEOUSDT bullish momentum. The local resistance level is PWH $11.75.
NEO/USDT Bullish Reversal on the Horizon? 👀🚀NEO Analysis💎 Paradisers, brace yourselves for an exciting trading opportunity with #NEOUSDT, as it's currently lining up for a bullish turnaround from its support zone.
💎 A look back reveals NASDAQ:NEO struggling to surpass its previous high, leading to a bearish sentiment. However, the tide seems to be turning. At the support level of $10.08, where it has already stirred up some buying interest, there's a strong possibility of a bullish shift aiming for the significant supply zone at $15.12.
💎 We, the shrewd traders, are always equipped with a Plan B. Should #NEO dip below our key support at $10.08, we're prepared to capitalize on a bullish rebound from a further support at $9.03. But be cautious, as a drop below this additional support could signal a deeper fall.

Neo-USD
I believe we are in great accumulation phase and its going to take a while before we break up.

Neo/usdt (NEO)The technical analysis of this asset reveals a dynamic and progressive impulsive wave system. As you've already noted, I place significant importance on historical data since the cycle tends to repeat itself. Currently, we are in the (b) phase, where in the past, we observed a robust consolidation followed by a powerful impulsive surge.


NEO/USDT This area so strong to sustain NEO, Ready for re-upward💎 NEO has undoubtedly garnered considerable attention in the crypto market, showcasing a significant rebound from its demand area. This resilience highlights the strength of the demand, hinting at NEO's potential to resume its upward trajectory.
💎 The focus now shifts to NEO's ability to breach and establish above a crucial resistance level, a move that probability could signal continued bullish momentum.
💎 However, should NEO struggle to ascend towards this key resistance area, there's a risk it might retract to the demand zone. A critical point to watch is NEO's performance in this demand area.
💎 A failure to maintain its position, particularly if it breaks below this zone, would be a stark bearish indicator. Such a breakdown would confirm a downward trend, with NEO likely to slide towards the next support level at approximately $8.7. In a more bearish scenario, NEO could extend its decline even further, reaching a stronger support level.


AntShares.. *cough* I mean $NEOAccumulation breakout
Trade accordingly and use proper risk management parameters.

🚀 NEO: Breakout from Weekly Pattern 🚀NEO, in a pivotal moment, grapples with a substantial weekly imbalance, acting as a steadfast barrier to further upward movement. Traders are eagerly eyeing the potential for a breakout, especially after three resilient tests of this crucial level, suggesting the emergence of a genuine upward surge.
📈 Key Observations:
💡 Formidable Weekly Imbalance:
NEO contends with a significant weekly imbalance, serving as a robust resistance to sustained upward momentum.
📊 Technical Analysis and Pattern Recognition:
🔄 Triple Test Dynamics:
NEO's market dynamics involve a thrice-over testing of this pivotal level, indicating a persistent struggle against formidable resistance.
☕ Cup and Handle Pattern:
The repetitive testing of the weekly imbalance draws parallels with the formation of a substantial cup and handle pattern, a classic indicator signaling a potential bullish breakout.
🔮 Anticipating a Breakout:
🎯 Third Time Charm:
The third test of this critical level is poised to act as the catalyst for a genuine breakout to the upside.
💼 Strategic Implications:
🚀 Potential for Upside Momentum:
Traders and investors are closely monitoring this potential breakout, envisioning a shift in market dynamics and the initiation of sustained upside momentum.
📝 Conclusion:
NEO's current position, marked by a resilient struggle against a significant weekly imbalance, suggests the potential for a breakout. The recurring dynamics, akin to a cup and handle pattern, amplify the anticipation of a bullish shift, with the third test of the crucial level holding the key to NEO's future price action.
🚀 Unlock my 3 crypto trading indicators for FREE! 🚀

NEO/USDT Could NEO Bouncing and continue Upward ??💎 NEO has recently become a focal point in the market, particularly with its bounce from the demand area. This rebound highlights the strength of the demand in preventing further price drops. There's a strong possibility that NEO might continue its upward movement, probability aiming to break through our identified strong resistance area.
💎 In the demand zone, a robust recovery is crucial for NEO. If it ends up merely consolidating in this area without a significant bounce, there's a risk that NEO could lose this key support zone. This could potentially lead to a downward movement, taking NEO back towards the Bullish OB area.

NEO - short ideaPrice reach top of the range and getting reject. You can try a short here. Expecting price will go down from here if not break this range high.


Neo longNeo has potential to reach around 20 $ , and it is one of the powerfull and oldest coins on market , now we can take this position wit Over 3 Risk/Reward lets take it

NEO WEEKLY BREAKOUT 595 day accumulation rangeup only soon, targeting $24 for my swing position. invalidation, close below box weekly.

NEO/USDTNEO is looking good in a weekly chart and is showing positive signs. After flipping the level in RED It will be a good time for an entry. If a daily or 4h candle closed above the level, you can an entry on this.
All the information you need is right there on the chart. It’s important to set a stop-loss, which is like a safety net to limit potential losses in case the market doesn’t go in the expected direction

$NEOUSDT - Ultra bullish trend incomingWeekly and Monthly chart looks very promising with a potential upside up to more or less $300. Double bottom with a cup and handle pattern in the weekly chart is a huge indicator that NEO is ready to make a huge move in the coming days. 300 is high likely the target if crypto bull market get's intact in the coming weeks/months. The best time to enter and wait for NEO is NOW! Caveat.

Here comes NEOWith the cup and holder bullish patern, neo wants to try 24 usd. The strong ressistance will be 19,10.
