NEO Price Rockets Toward $20 Milestone Amid Altcoin SurgeThe cryptocurrency market is witnessing a seismic shift as altcoins surge, with SET:NEO leading the charge with a remarkable 40% overnight surge, propelling its price toward the coveted $20 mark. This surge comes on the heels of a pre-halving rally, igniting speculation of a potential year-long bull run.
SET:NEO , currently ranked 77th in the crypto market with a market cap approaching $1.50 billion, has emerged as a top performer amid this altcoin resurgence. The surge in demand has resulted in an impressive bullish engulfing candle on the daily chart, signaling a potential moonshot trajectory.
One of the most striking aspects of SET:NEO 's rally is the staggering increase in trading volumes, up by over 4000%, underscoring the growing investor interest and making SET:NEO a trending coin in the crypto sphere. Additionally, the breakout above the overhead resistance trendline has propelled NEO's price beyond the psychological barrier of $20, reaching a peak of $22.45 before undergoing a minor intraday pullback to $20.89.
Technical Analysis and Future Projections:
The rally is strongly supported by the 50-day Exponential Moving Average (MA), maintaining a bullish alignment with the 200-day MA, indicating a favorable position for a sustained uptrend.
Looking ahead, sustaining the price above $20 is crucial for NEO's continued upward trajectory. According to trend-based Fibonacci levels, a breakout above $22 could signal further upside potential, potentially catapulting SET:NEO 's price toward the $30 mark in the near term.
However, amidst the euphoria, caution is warranted as NEO approaches overbought territory, as indicated by extreme volatility around the token on the Bollinger Bands. A retracement to around $17.87 cannot be ruled out in a highly bearish scenario. Nonetheless, indications from the Awesome Oscillator suggest increasing upward momentum for SET:NEO , potentially defying bearish bias and aiming for $25 in the short term.
As the altcoin market continues to heat up, all eyes are on SET:NEO as it aims to solidify its position and potentially usher in a new era of bullish momentum. Investors eagerly await further developments as SET:NEO navigates the volatile cryptocurrency landscape.
Conclusion:
With SET:NEO leading the altcoin charge and eyeing the $20 milestone, the cryptocurrency market is witnessing a resurgence fueled by growing investor optimism and bullish momentum. As NEO's journey unfolds, it remains to be seen whether it can sustain its meteoric rise and pave the way for further gains in the days to come.
NEOUST trade ideas

NEOUSDT(NEO) Daily tf Range Updated till 09-04-24NEOUSDT(NEO) Daily timeframe range. very close to reach 23.44 before a retrace took place. recent retrace point is at 18.05. if it can hold above there reaching 23.44 wont be that hard.

Neo price recalled that they can not only fall but also grow?)Who knows what happened to the SET:NEO project, that the "Chinese Ethereum killer" woke up from hibernation and made a sharp 30% price increase?)
Maybe it will also wake up its "partner in crime" - NYSE:EOS ?)
But seriously, if #NEOUSDT buyers have the strength and intention to continue growing, then in the coming days they should defend $19-20 and not allow the price to fall below.
In this case, the targets for the #NEOUSD price to rise to $29 or even $36 in the medium term will become more than realistic.
_____________________
Did you like our analysis? Leave a comment, like, and follow to get more

NEO is still bullishFrom where we entered "start" on the chart, a time-consuming triangle has started, and from where we placed a green arrow on the chart, this triangle has ended and we have entered a bullish wave.
This bullish wave is either an ABC or a more complex pattern.
We should now be in the middle of wave B.
By maintaining the green range, it can move towards TP.
Closing a daily candle below the invalidation level will violate the analysis.
For risk management, please don't forget stop loss and capital management
When we reach the first target, save some profit and then change the stop to entry
Comment if you have any questions
Thank You

NEO FOR FUNDING TRADERS For all funding traders who deal with this business, mostly the broker gives you some of the cryptocurrencies to trade. Neo is one of them.
I see some liquidity between 14-15 and at the same time a vector candlestick that appears and it fills up until 12.18. Wait for the market makers to do what they have to do and come back at low prices, maybe a little higher, maybe a little lower. Another scenario that can happen is a breakthrough from a double bottom that has been in place for more than a year. Targets can be POC range 08 December 2021 - 01 May 2022, VAH and at the same time the maximum target of pattern 29.37.

Neo SuperbAfter receiving multiple buy and sell prints, we have come to reversal of uptrend with the sell print. our target is 18.8 area. DYOR

NEOUSDT Has a Clear Breakout NEOUSDT Looks amazing with a strong breakout after a long consolidation.
Upside looks 40/52/60 Easy targets
Long Term Can hit above 100

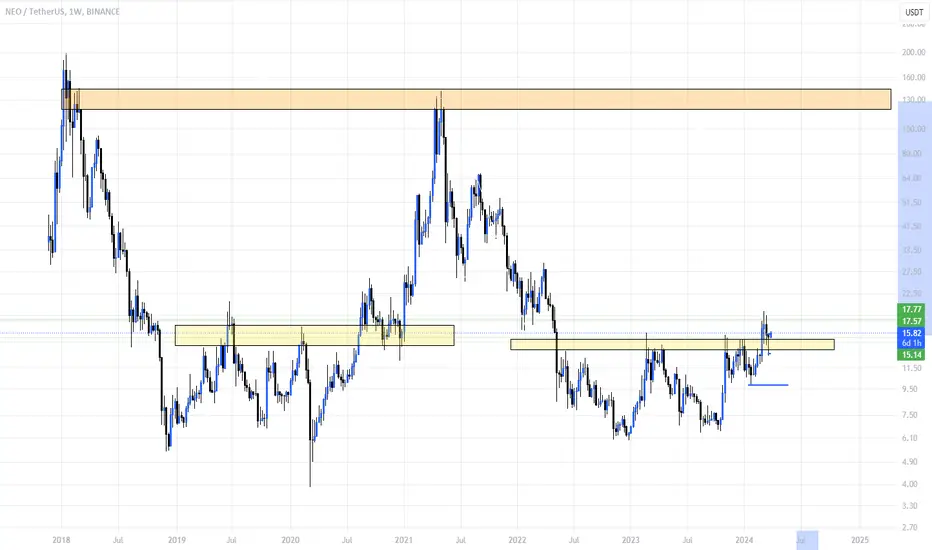
NEOUSDT 1W LONG📈Hi all. Timeframe 1 week. NEOUSDT, after a decline, is in accumulation with increased volumes. Fractal of past decline and accumulation, and subsequent growth. I’m considering recruitment to the spot now, with a possible addition from the green zone. Also long during breakout/retest. Let me remind you that the entry at the retest is the safest, but it may not be there if there is a strong exit from the accumulation. It all depends on your trading strategy. Marked goals and levels on the chart.

NEO - BUY SETUP (NOV 2023)NEO - BUY SETUP (NOV 2023)
Based on technical analysis, the current setup of this coin appears to offer a favorable buying opportunity. The price action and key indicators signal promising trends, suggesting a potential advantageous entry point. However, prudent consideration of market volatility and risk management is essential before making any investment decisions in the cryptocurrency market.

NEO/USDT planning for bullish reversal? 👀🚀NEO analysis💎 Paradisers, the #NEOUSDT is currently displaying notable strength, hinting at a potential bullish reversal from its demand level at $14.79. If the price sustains its momentum at this level, there is a significant likelihood of a bullish upswing that could surpass the nearby supply.
💎 Reflecting on historical patterns, #NEO has consistently followed a downward trend, frequently encountering resistance around $17.01. Our analysis suggests that the price may revisit the demand level at $14.79 before embarking on a further bullish trajectory. Interestingly, this level has been respected twice in the past.
💎 In the event that NASDAQ:NEO faces challenges in maintaining its momentum at the $14.79 demand, we anticipate a bullish recovery from the lower demand zone around $13.30. However, a breach below this point could potentially lead to additional declines. Let’s remain vigilant and be prepared to adapt our strategies as needed.

#NEOUSDT $NEOUSDT #NEO Long BiasIf price stays above the Green Box then you can take profit on these levels. Good Luck.

NEO - Heading straight to next targetBINANCE:NEOUSDT (4H CHART) Technical Analysis Update
NEO is currently trading at $11.73 and showing overall positive sentiment
Price broke-out from the resistance easily and we are seeing back to back green candles.
We are expect this trend to continue and see some pullbacks at the resistance around 13.5
Entry level: $ 11.00 - 11.74
Stop loss level: $0.06
Target 1: $ 12.51
Target 2: $ 13.39
Target 3: $ 14.91
Max Leverage: 2x
Don't forget to keep stop loss.
Follow Our TradingView Account for More Technical Analysis Updates, | Like, Share and Comment Your thoughts.
Cheers
GreenCrypto

NEO/USDT A Breakout the resistance, Indicating Bullish momentum.💎 NEO has recently encountered significant market dynamics, currently facing resistance. A breakthrough above this level is crucial for NEO to regain bullish momentum and continue its upward movement towards our target area.
💎 However, if NEO fails to overcome the resistance and experiences rejection, it may retreat to test support levels around $13.5 or even potentially drop further to the demand area around $10 if the support is breached.
💎 When NEO reaches the demand area, a bounce is necessary as this level holds significant importance. Failure to sustain the demand zone would signal a bearish sentiment, potentially leading to further downward movement in NEO's price.

NEO - Another altcoin that looks AMAZINGSpring and backtest of key historical support completing a bullish harmonic with a type two return and bullish divergence. Nothing more to ask.
This one is priced too high for an entry right now so we wait for some pa to unfold and hopefully a retrace to backtest the local support.

NEO/USDT in the Position to Rally?👀🚀 NEO Analysis💎Paradisers, let's shift our focus to #NEOUSDT, where current indicators suggest a potential bullish reversal brewing within its critical support range.
💎Upon examining #Neo's recent market performance, we witness an impressive 100% surge from its recent peak. Yet, the resilience demonstrated at the $12.17 support level hints at a pathway to upward momentum.
💎Despite encountering obstacles in surpassing previous highs, leading to a temporary bearish sentiment, the significance of the $12.17 support level cannot be understated for #NEO. It teeters on the edge of igniting a substantial bullish surge with a fresh outlook.
💎As proactive traders, we always have contingency plans in place. If #NEO experiences further decline from this support, we stand prepared for a bullish resurgence commencing from the secondary support at $10.56. However, it's imperative to recognize that a breach below this level could signify the onset of more profound bearish trends.
💎Remain adaptable in your trading strategies and maintain a vigilant eye on market shifts, Paradisers. Your Paradise Team diligently monitors these evolving market terrains, ready to guide you through any twists and turns.

NEOUSDT TODAY A SLEEPING GIANT1-Apply your own risk management or follow Precisely my management.
2-Daily and Weekly Targets
3-Raise Often Your SL to protect your profits.
4-Use 12 % SPOT
5-Use 7% on Futures with LEV5
NASDAQ:NEO IS WOW

NEO's Situation: What Shall we Expect ?Hi.
COINEX:NEOUSDT
✅ Today, I want to analyze NEOUSDT for you in a 4H time frame so that we can have a Short-term view of NEO regarding the technical analysis. (Please ✌️ respectfully ✌️share if you have a different opinion from me or other analysts).
➡️Double bottom is in formed on weekly timeframe.
Looking for the retest of the neckline, If the neck breaks, it will witness good growth.
- High potential areas are clear in the chart.
- You can look for reasons to enter according to your own personal strategy after approval.
-AB=CD
Stay awesome my friends.
_ _ _ _ _ _ _ _ _ _ _ _ _ _ _ _ _ _ _ _ _ _ _ _ _ _ _ _ _ _ _ _ _
✅Thank you, and for more ideas, hit ❤️Like❤️ and 🌟Follow🌟!
⚠️Things can change...
The markets are always changing and even with all these signals, the market changes tend to be strong and fast!!


$neo not in this but shall hop on if given a dump over the weekend
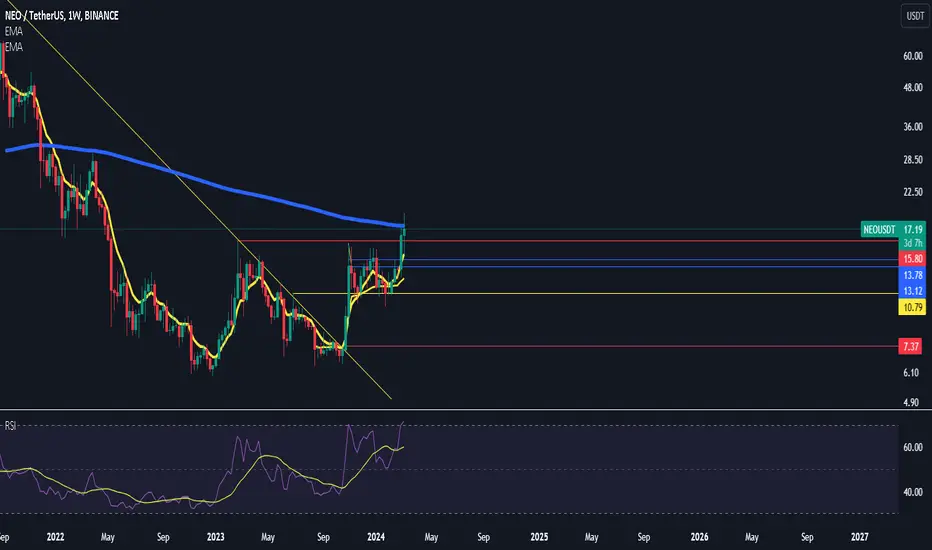
broke outta range now attmempting to flip 200 ema
we know what comes next
NEO still Bullish for NowNEO had a major pullback with the rest of the crypto market yesterday. However, it still seems to be ranging in this parallel channel on the daily, and has jumped the creek in wychoff terms, pulling back to just under the pink line and back above it and the middle line of the channel. If it loses support above the pink line, I think we will revisit $13 or so on the bottom part of the parallel channel.
If support holds above the midline on the parallel channel, I think we will see another impulse up to the $32 area.

NEO/USDT Break Alert!! Indicating Bullish Momentum for NEO💎 NEO has recently exhibited significant market dynamics, notably breaking above the key resistance level of the accumulation phase.
💎This breakout signals a bullish momentum for NEO, with the probability of continued upward movement toward our target area.
💎 However, if NEO retraces back into the accumulation phase area, breaching the support level, it would indicate a false breakout and could trigger a downward movement toward the demand area.
💎 In such a scenario, it is crucial for NEO to bounce off the demand area and reclaim the area above the resistance to resume its bullish momentum. Failure to do so may result in further downward movement towards the key support area.

Old friends coming...All old alt coins "bttc, hot, chz, doge etc are crazy bullish! Win Win time. Neo has flag and at the same time cup and holder...
