The similarities in behaviourNASDAQ:TSLA CAPITALCOM:NATURALGAS
This is just another example, we can see in depth of the trades that has been involved and the footprint it leaves behind. Everything matters as we can see the psychology behind the trades taken (potential manipulation involved), searching for pools or making test for better supply/demand. we can see a big similarity in this. Im not saying that nat gas will follow the same path as Tesla but the traps/moves are made in a strategic way that we have seen identical trading behaviour so far. Long in general but needs to fill FVG on daily tf.
NG trade ideas

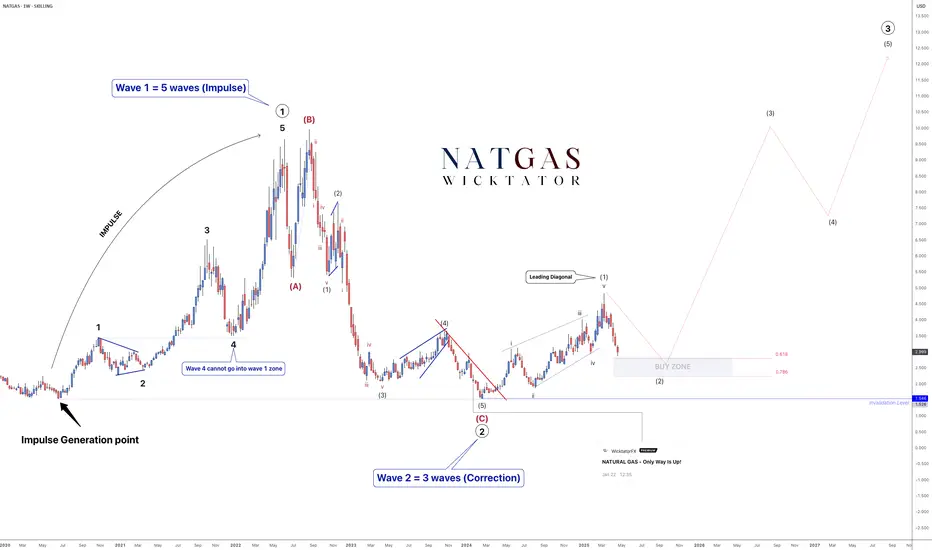
NATGAS Elliott Waves – Preparing for a Multi-Year Rally!Following our last post on Natural Gas, we have now seen a breakout, suggesting the start of a larger bullish wave — a move that could last multiple years.
From a technical perspective:
- Wave 1 (5-wave impulse) is complete.
- Wave 2 (ABC correction) is also complete.
- We are now in Wave 3, which itself will form 5 subwaves.
Wave 3:
Subwave 1 of Wave 3 has formed as a leading diagonal.
We are now in Subwave 2, which typically retraces around 61.8% of Subwave 1.
Our buy zone is positioned around this retracement area, and we will be looking for a lower timeframe breakout to confirm entries.
Important note:
Subwave 2 could form a more complex ABC correction, so patience is required while it develops.
Trade Plan:
- Wait for price to reach the buy zone.
- Look for lower timeframe bullish confirmation (trendline break, BOS, structure shift, etc.).
- Enter after confirmation.
Stoploss Placement:
- Aggressive option: Below the corrective low.
- Conservative option: Below the broader invalidation level.
Targets: 8, 10, 12
See below for our last NatGas analysis:
Natural Gas (Henry Hub) – Intraday Outlook | April 30, 2025Volume-based outlook using VSA methodology and key price levels
🕐 Daily Timeframe (D1):
The April 28 daily bar formed a bullish Wide spread bar on high volume. However, price is now approaching a key resistance zone at 3.4714, where sellers previously showed control.
🕐 Hourly Timeframe (H1):
On the M60 chart, we’re seeing the development of an ascending channel.
Just like on the daily, there’s also a bullish wide-spread bar with high volume, signaling the presence of a strong buyer in the market.
However, we haven’t seen a test of that buying effort yet — I'm marking 3.2556 as a likely test zone.
If price breaks and consolidates above the daily level 3.3714 today, this would confirm buyer strength and open the way toward a breakout above the recent swing high at 3.4501.
If the market closes below 3.3714 today, watch for price action near the 3.2556 test level:
If buyers hold 3.2556 → potential targets:
-3.3714 (retest)
-3.4501 (swing high)
If 3.2556 fails and price consolidates below → watch for a deeper move toward:
-Lower boundary of the current range
-Low of the bullish effort bar at 3.0785
Disclaimer: This content is for educational purposes only and does not constitute financial advice.
#TechnicalAnalysis #DayTrading #VSA #NG #HenryHub #NaturalGas #FuturesTrading #VolumeSpreadAnalysis

DON'T MISS! NATGAS Long Opportunity (1:7 RR)Monthly structure breakout & retest. Wait for the price to pullback to the key level area (taking out the low wick of the monthly inside bar) to get in. Trade safe.

Natural Gas: Consolidating and Preparing for a Move UpNatural gas is consolidating near a major support level and is beginning to slowly move higher.
I believe this is a good opportunity to enter a long position , with an initial target around the 3.50–3.60 area.
Important:
❗️Natural gas is an extremely volatile asset and often opens with large gaps.
Make sure to adjust your position size accordingly to manage the risk associated with this volatility.

Short term bounce for big short Trading between 4&2. Momentum is down but expect a 10% increase in the following week(s). Short after the pullback.

NATGAS - Sell Trade IdeaHere we are looking to sell, short term Bias area now Bearish.
Im looking to sell into the previous market gap that hasnt been tested.
ENTRY @3.430
TP @2.396
SL @3.743
This is a free signal, good luck to anyone that follows

Short term bounce to further short Expecting a bounce to 3200ish to continue to trend further downwards

Double Top, Beginning of down trend into the $2'sDouble Top, Beginning of down trend into the $2's.
Targeting $2.8
Looking for a move to $2 and $1.8 later in the year due to bearish fundamentals.

Natural Gas: Right Shoulder Formation Before Next Sell Order.Our previous analysis accurately predicted the gas market sell-off, allowing us to align with sellers and identify the neckline of a significant head and shoulders pattern.
Now, we're tracking a potential buying opportunity, anticipating the completion of the pattern's right shoulder.
Join us as we target defined profit objectives #1 and #2.
Once these targets are achieved, we'll be ready to shift gears and realign with sellers, maximizing your portfolio's performance through Candlestick Pattern analysis and proactive positioning.

NG looks bullish short to medium termThis is one of the trade ideas for this week. NG looks like it found a good support at the psychological round number 3.0 and previous support level. Fundamentals are a bit of a mixed bag, however potential increases in LNG exports (driven by trade deals) and industrial demand from AI data centers and reshoring could provide bullish support in the near term.
Trade smart, be kind, stay strong 💚

Natural gas buy trade Natural gas can be brought when the price takes rejection from demand zone . Sl below the zone target supply zone .

XNGUSD Bullish Crab Pattern.Attention investors and energy enthusiasts!
The natural gas market is heating up with exciting developments.
We anticipate a significant surge in natural gas prices, projected to rise from $3.65 to $4.35 in three strategic phases based on Crab Harmonic Pattern .
This forecast reflects a robust demand landscape and evolving market dynamics. As the energy sector continues to adapt, seizing this opportunity could position you ahead of the curve.
Stay informed and take action now!
Embrace the potential for growth in natural gas investments.
SEYED.

Nat Gas Continued ShortFirst target at 2.880.
Headwinds in my main focus are chinas restart. Alot of rumor priced in but facts will send it lower. Sunshine ahead.

The Natural gas will make a dip once againNATURAL GAS H1 Analysis 📊
First of all , lets take about the gap
war , This gap is due to war and as you know market will refill it sooner or later , thats the main reason of the selling
Yes, no doubt , the market can go up for some sl hunting thats why the red zone is little wider
The ultimate trend is sell due to no investors in gas because all the investors are busy in the BITCOIN AND GOLD. so it will come back at its lowest support sooner or later
Follow the money management strictly and this is just the prediction.
Natural gas bullish?With elliot wave and possible time-cycle, there is a strong possibility of a strong upmove as long as price convincingly stays above current lows.

Natural Gas Wave Analysis – 21 April 2025
- Natural gas broke support area
- Likely to fall to support level 3.0000
Natural gas recently broke the support area between the support trendline of the weekly up-channel from last August, support level 3.4 and the 50% Fibonacci correction of the daily uptrend from August.
The breakout of this support area accelerated the active short-term impulse wave 5 of the intermediate impulse wave (C) from the end of March.
Natural gas can be expected to fall to the next round support level 3.0000 (target price for the completion of the active impulse wave (C)).

NATGAS - Bearish Head and ShouldersHello Traders !
The Natural Gas price formed a head and shoulders pattern.
Currently, The neckline is broken !
So, I expect a bearish move📉
_______________
TARGET: 3.2350🎯

XNG/USD "Natural Gas" Energy Market Robbery Plan (Scalping/Day)🌟Hi! Hola! Ola! Bonjour! Hallo! Marhaba!🌟
Dear Money Makers & Robbers, 🤑💰✈️
Based on 🔥Thief Trading style technical and fundamental analysis🔥, here is our master plan to heist the XNG/USD "Natural Gas" Energy Market. Please adhere to the strategy I've outlined in the chart, which emphasizes short entry. Our aim is the high-risk Green Zone. Risky level, oversold market, consolidation, trend reversal, trap at the level where traders and bullish robbers are stronger. 🏆💸Book Profits Be wealthy and safe trade.💪🏆🎉
Entry 📈 : "The heist is on! Wait for the breakout (3.800) then make your move - Bearish profits await!"
however I advise placing Sell Stop Orders below the breakout MA or Place Sell limit orders within a 15 or 30 minute timeframe. Entry from the most recent or closest low or high level should be in retest. I Highly recommended you to put alert in your chart.
📌I strongly advise you to set an "alert (Alarm)" on your chart so you can see when the breakout entry occurs.
Stop Loss 🛑: Thief SL placed at 4.200 (Scalping / Day Trade Basis) Using the 3H period, the recent / swing high or low level.
SL is based on your risk of the trade, lot size and how many multiple orders you have to take.
Target 🎯: 3.400 (or) Escape Before the Target
🧲Scalpers, take note 👀 : only scalp on the Short side. If you have a lot of money, you can go straight away; if not, you can join swing traders and carry out the robbery plan. Use trailing SL to safeguard your money 💰.
💨⛽XNG/USD "Natural Gas" Energy Market Heist Plan (Scalping / Day Trade) is currently experiencing a bearishness,., driven by several key factors.
📰🗞️Get & Read the Fundamental, Macro, COT Report, Inventory and Storage Analysis, Seasonal Factors, Sentimental Outlook, Intermarket Analysis, Future trend targets.. go ahead to check 👉👉👉🔗
⚠️Trading Alert : News Releases and Position Management 📰 🗞️ 🚫🚏
As a reminder, news releases can have a significant impact on market prices and volatility. To minimize potential losses and protect your running positions,
we recommend the following:
Avoid taking new trades during news releases
Use trailing stop-loss orders to protect your running positions and lock in profits
💖Supporting our robbery plan 💥Hit the Boost Button💥 will enable us to effortlessly make and steal money 💰💵. Boost the strength of our robbery team. Every day in this market make money with ease by using the Thief Trading Style.🏆💪🤝❤️🎉🚀
I'll see you soon with another heist plan, so stay tuned 🤑🐱👤🤗🤩

Weekly chart says it want to skyrocket Weekly chart says it want to skyrocket .
As it's weekly chart 10-15% dip still cannot be denied .
I am expecting minimum $6 as primary target.

Natural Gas (Henry Hub) – Intraday Outlook | May 1, 2025The previous idea played out well — price hit the first long target cleanly and came just short of the second target, which was 3.4501
📍 Current outlook:
I've updated the ascending channel based on the new pivot points.
If we see a strong buy reaction from the 3.3575 level, I’ll expect to complete the move to 3.4501, and the next goal will be the upper boundary of the channel.
However, if price closes below 3.3585, we may be seeing the beginning of a range formation, with downside potential toward the 3.2556 support zone.
#TechnicalAnalysis #DayTrading #VSA #NG #HenryHub #NaturalGas #FuturesTrading #VolumeSpreadAnalysis

Natural gas prices may be poised for a short-term reboundNatural gas prices have fallen by nearly 30% since early March and now appear to have reached oversold conditions, suggesting a potential bounce of more than 10% back to $3.75 per million British thermal units. Natural gas has risen above its 10-day exponential moving average (EMA), indicating a possible short-term trend change. The 10-day EMA, which previously acted as resistance, could provide support as the commodity’s price increases. A failure to maintain it may signal that the attempted trend reversal has been unsuccessful.
Natural gas reached oversold conditions around 20 April, when its relative strength index (RSI) fell to 30 and prices touched the lower Bollinger Band. Momentum now appears to be shifting, with the RSI showing signs of turning upwards and potentially breaking its downtrend. If this positive momentum continues building, natural gas prices could rise towards their 20-day simple moving average (SMA) at $3.56. Should prices extend beyond the 20-day SMA, they could rise to $3.75, where prices consolidated for several days around early April.
A failure to reach the 20-day SMA, or an inability to push beyond that level, could suggest natural gas prices may fall back to retest recent lows around $3.05 to $3.10, with the potential to decline further towards the lower Bollinger Band at $2.85.
For now, natural gas prices indicate a possible short-term turnaround. However, prices will need to continue extending higher to confirm that a bottom has indeed been reached.
Written by Michael J Kramer, founder of Mott Capital Management
Disclaimer: CMC Markets is an execution-only service provider. The material (whether or not it states any opinions) is for general information purposes only and does not take into account your personal circumstances or objectives. Nothing in this material is (or should considered to be) financial, investment or other advice on which reliance should be placed.
No opinion given in the material constitutes a recommendation by CMC Markets or the author that any particular investment, security, transaction, or investment strategy is suitable for any specific person. The material has not been prepared in accordance with legal requirements designed to promote the independence of investment research. Although we are not specifically prevented from dealing before providing this material, we do not seek to take advantage of the material prior to its dissemination.

Natural Gas: Watching for a Break Above 3.40 to Re-Enter LongOverall, I remain bullish on natural gas, as I mentioned yesterday, and even entered a position.
However, I didn’t hold through the entire move. There are definitely some issues with overtrading that I need to work on.
At the moment, I’m out of the market and considering a re-entry only if yesterday’s high at 3.39 is broken.
If the price moves above 3.40, I plan to re-enter the position, targeting the 3.60 level.
